repeatmasker_data
Renee Matthews
2025-09-11
Last updated: 2026-01-27
Checks: 7 0
Knit directory: DXR_continue/
This reproducible R Markdown analysis was created with workflowr (version 1.7.1). The Checks tab describes the reproducibility checks that were applied when the results were created. The Past versions tab lists the development history.
Great! Since the R Markdown file has been committed to the Git repository, you know the exact version of the code that produced these results.
Great job! The global environment was empty. Objects defined in the global environment can affect the analysis in your R Markdown file in unknown ways. For reproduciblity it’s best to always run the code in an empty environment.
The command set.seed(20250701) was run prior to running
the code in the R Markdown file. Setting a seed ensures that any results
that rely on randomness, e.g. subsampling or permutations, are
reproducible.
Great job! Recording the operating system, R version, and package versions is critical for reproducibility.
Nice! There were no cached chunks for this analysis, so you can be confident that you successfully produced the results during this run.
Great job! Using relative paths to the files within your workflowr project makes it easier to run your code on other machines.
Great! You are using Git for version control. Tracking code development and connecting the code version to the results is critical for reproducibility.
The results in this page were generated with repository version 673eebd. See the Past versions tab to see a history of the changes made to the R Markdown and HTML files.
Note that you need to be careful to ensure that all relevant files for
the analysis have been committed to Git prior to generating the results
(you can use wflow_publish or
wflow_git_commit). workflowr only checks the R Markdown
file, but you know if there are other scripts or data files that it
depends on. Below is the status of the Git repository when the results
were generated:
Ignored files:
    Ignored:    .Rhistory
    Ignored:    .Rproj.user/
    Ignored:    data/Bed_exports/
    Ignored:    data/Cormotif_data/
    Ignored:    data/DER_data/
    Ignored:    data/Other_paper_data/
    Ignored:    data/RDS_files/
    Ignored:    data/TE_annotation/
    Ignored:    data/alignment_summary.txt
    Ignored:    data/all_peak_final_dataframe.txt
    Ignored:    data/cell_line_info_.tsv
    Ignored:    data/full_summary_QC_metrics.txt
    Ignored:    data/motif_lists/
    Ignored:    data/number_frag_peaks_summary.txt

Untracked files:
    Untracked:  H3K27ac_all_regions_test.bed
    Untracked:  H3K27ac_consensus_clusters_test.bed
    Untracked:  analysis/GREAT_H3K27ac.Rmd
    Untracked:  analysis/H3K27ac_ChromHMM_FC.Rmd
    Untracked:  analysis/H3K27ac_cisRE.Rmd
    Untracked:  analysis/Top2a_Top2b_expression.Rmd
    Untracked:  analysis/maps_and_plots.Rmd
    Untracked:  analysis/proteomics.Rmd
    Untracked:  other_analysis/

Unstaged changes:
    Modified:   analysis/H3K27ac_RNA_integration.Rmd
    Modified:   analysis/H3K27ac_TF_motifs.Rmd
    Modified:   analysis/chromHMM.Rmd
    Modified:   analysis/final_analysis.Rmd
    Modified:   analysis/summit_files_processing.Rmd
Note that any generated files, e.g. HTML, png, CSS, etc., are not included in this status report because it is ok for generated content to have uncommitted changes.
These are the previous versions of the repository in which changes were
made to the R Markdown (analysis/repeatmasker_data.Rmd) and
HTML (docs/repeatmasker_data.html) files. If you’ve
configured a remote Git repository (see ?wflow_git_remote),
click on the hyperlinks in the table below to view the files as they
were in that past version.
| File | Version | Author | Date | Message |
|---|---|---|---|---|
| Rmd | 673eebd | reneeisnowhere | 2026-01-27 | updates to graph |
| html | 712c8a5 | reneeisnowhere | 2025-10-06 | Build site. |
| Rmd | 2b33697 | reneeisnowhere | 2025-10-06 | adding in millidiv/1e-9 |
| html | f5c590c | reneeisnowhere | 2025-10-06 | Build site. |
| Rmd | 95365f1 | reneeisnowhere | 2025-10-06 | adding in millidiv/2.2e-9 |
| html | 1f6e044 | reneeisnowhere | 2025-10-03 | Build site. |
| Rmd | d48317b | reneeisnowhere | 2025-10-03 | adding in repeatmasker |
| Rmd | 9d77dac | reneeisnowhere | 2025-09-24 | end of day |
| html | 1b0e001 | reneeisnowhere | 2025-09-23 | Build site. |
| Rmd | 2607095 | reneeisnowhere | 2025-09-23 | changing to parts per thousand =milliDiv |
| html | abd595b | reneeisnowhere | 2025-09-23 | Build site. |
| Rmd | c5fd708 | reneeisnowhere | 2025-09-23 | wflow_publish("analysis/repeatmasker_data.Rmd") |
| html | cf939c4 | reneeisnowhere | 2025-09-23 | Build site. |
| Rmd | 6b65c26 | reneeisnowhere | 2025-09-23 | wflow_publish("analysis/repeatmasker_data.Rmd") |
| html | fe42ebc | reneeisnowhere | 2025-09-16 | Build site. |
| Rmd | 6e58d85 | reneeisnowhere | 2025-09-16 | first setup |
| html | 967b7a8 | reneeisnowhere | 2025-09-16 | Build site. |
| Rmd | 48f3b75 | reneeisnowhere | 2025-09-16 | first setup |
| Rmd | 06d2af1 | reneeisnowhere | 2025-09-16 | wflow_git_commit("analysis/repeatmasker_data.Rmd") |
libraries
library(tidyverse)
library(DT)
library(genomation)
library(GenomicRanges)
library(BiocParallel)
library(TxDb.Hsapiens.UCSC.hg38.knownGene)
library(ChIPseeker)
library(plyranges)
library(ggsignif)
library(ggpubr)
library(ggrepel)
Loading data files
repeatmasker <- read_delim("data/Other_paper_data/repeatmasker_20250911.txt",
    delim = "\t", escape_double = FALSE,
    trim_ws = TRUE)
peakAnnoList_H3K27ac <- readRDS("data/motif_lists/H3K27ac_annotated_peaks.RDS")
peakAnnoList_H3K27me3 <- readRDS("data/motif_lists/H3K27me3_annotated_peaks.RDS")
peakAnnoList_H3K36me3 <- readRDS("data/motif_lists/H3K36me3_annotated_peaks.RDS")
peakAnnoList_H3K9me3 <- readRDS("data/motif_lists/H3K9me3_annotated_peaks.RDS")autosomes <- paste0("chr", 1:22)
repeatmasker_clean <- repeatmasker %>% mutate(
strand = ifelse(strand == "C", "-", "+")
) %>%
mutate(
start = genoStart + 1,
end = genoEnd)%>%
mutate(repFamily= str_remove(repFamily, "\\?$")) %>%
dplyr::filter(genoName %in% autosomes)
rpt_split <- split(repeatmasker_clean, repeatmasker_clean$repClass)
rpt_split_gr_list <- lapply(rpt_split, function(df) {
GRanges(
seqnames = df$genoName,
ranges = IRanges(start = df$start, end = df$end),
strand = df$strand,
repName = df$repName,
repClass = df$repClass,
repFamily = df$repFamily,
swScore = df$swScore,
milliDiv = df$milliDiv,
id = df$id
)
})
rmskr_std_gr <- GRanges(
seqnames = repeatmasker_clean$genoName,
ranges = IRanges(
start = repeatmasker_clean$start,
end = repeatmasker_clean$end
),
strand = repeatmasker_clean$strand,
repName = repeatmasker_clean$repName,
repClass = repeatmasker_clean$repClass,
repFamily = repeatmasker_clean$repFamily,
swScore = repeatmasker_clean$swScore,
milliDiv = repeatmasker_clean$milliDiv,
milliDel = repeatmasker_clean$milliDel,
milliIns = repeatmasker_clean$milliIns,
id = repeatmasker_clean$id
)
##checking chromosomes
#seqlevels(rmskr_std_gr)
###making granges lists out of motifs
H3K27ac_sets_gr <- lapply(peakAnnoList_H3K27ac, function(df) {
as_granges(df)
})
H3K27me3_sets_gr <- lapply(peakAnnoList_H3K27me3, function(df) {
as_granges(df)
})
H3K36me3_sets_gr <- lapply(peakAnnoList_H3K36me3, function(df) {
as_granges(df)
})
H3K9me3_sets_gr <- lapply(peakAnnoList_H3K9me3, function(df) {
as_granges(df)
})H3K27ac and TEs
## this is now taking the overlaps and widths of the TE and roi, then calculating percentage overlaps for each (pct_te_overlap and pct_roi_overlap)
# H3K27ac_ols <- lapply(H3K27ac_sets_gr, function(df) {
#     overlaps <- join_overlap_inner(df, rmskr_std_gr)
#    # overlap base pairs
#   })
H3K27ac_ols <- lapply(H3K27ac_sets_gr, function(df) {

   # 1️⃣ find overlaps
  hits <- findOverlaps(df, rmskr_std_gr)

  # 2️⃣ intersect the overlapping ranges
  overlaps_gr <- pintersect(df[queryHits(hits)], rmskr_std_gr[subjectHits(hits)])

  # 3️⃣ convert to data frame
  overlaps_df <- as.data.frame(overlaps_gr)

  # 4️⃣ add overlap length
  overlaps_df$overlap_bp <- width(overlaps_gr)

  # 5️⃣ ROI lengths & % coverage
  roi_widths <- width(df)
  names(roi_widths) <- df$Peakid
  overlaps_df$roi_len <- roi_widths[as.character(overlaps_df$Peakid)]
  overlaps_df$pct_roi_overlap <- (overlaps_df$overlap_bp / overlaps_df$roi_len) * 100

  # 6️⃣ TE lengths & % coverage
  te_widths <- width(rmskr_std_gr)
  overlaps_df$te_len <- te_widths[subjectHits(hits)]
  overlaps_df$pct_te_overlap <- (overlaps_df$overlap_bp / overlaps_df$te_len) * 100

  # 7️⃣ Add TE metadata from rmsk GRanges
  overlaps_df$repName   <- rmskr_std_gr$repName[subjectHits(hits)]
  overlaps_df$repClass  <- rmskr_std_gr$repClass[subjectHits(hits)]
  overlaps_df$repFamily <- rmskr_std_gr$repFamily[subjectHits(hits)]
  overlaps_df$milliDiv <- rmskr_std_gr$milliDiv[subjectHits(hits)]
  overlaps_df$milliDel <- rmskr_std_gr$milliDel[subjectHits(hits)]
  overlaps_df$milliIns <- rmskr_std_gr$milliIns[subjectHits(hits)]

  overlaps_df
})
rmskr_nonoverlapping_H3K27ac_gr <- rmskr_std_gr[countOverlaps(rmskr_std_gr, H3K27ac_sets_gr[[4]]) == 0]

H3K27ac_ols$Set_1 %>%
  as.data.frame() %>%
  group_by(Peakid,repClass) %>%
  summarise() %>%
  group_by(Peakid) %>% tally %>%
  group_by(n) %>% tally
# A tibble: 8 × 2
n nn
<int> <int>
1 1 40854
2 2 30144
3 3 12604
4 4 4120
5 5 1127
6 6 171
7 7 5
8 8 1H3K27ac_ols$Set_1 %>%
as.data.frame() %>%
group_by(Peakid) %>%
summarize(.,
repClass=paste0(unique(repClass), collapse=";"))# A tibble: 89,026 × 2
Peakid repClass
<chr> <chr>
1 chr10:100005111-100005718 LINE;SINE
2 chr10:100006009-100007728 SINE;LINE
3 chr10:100008216-100011014 SINE;Simple_repeat;Unknown;LINE
4 chr10:100043350-100044800 SINE;DNA;Low_complexity
5 chr10:100046129-100046853 LTR;SINE
6 chr10:100184879-100187424 DNA
7 chr10:100199091-100199540 SINE
8 chr10:10020802-10021452 SINE;LTR
9 chr10:100208189-100209822 SINE;LTR
10 chr10:100226355-100227311 LINE
# ℹ 89,016 more rowsH3K27ac_ols$Set_2 %>%
as.data.frame() %>%
group_by(Peakid,repClass) %>%
summarise() %>%
group_by(Peakid) %>% tally %>%
group_by(n) %>% tally# A tibble: 6 × 2
n nn
<int> <int>
1 1 513
2 2 411
3 3 195
4 4 38
5 5 8
6 6 1H3K27ac_ols$Set_2 %>%
as.data.frame() %>%
group_by(Peakid) %>%
summarize(.,
repClass=paste0(unique(repClass), collapse=";"))# A tibble: 1,166 × 2
Peakid repClass
<chr> <chr>
1 chr10:103196972-103198089 LINE;SINE;Low_complexity
2 chr10:103898324-103899678 LINE;SINE
3 chr10:104775314-104776084 SINE;LINE
4 chr10:105604321-105604967 SINE;LINE;LTR;Simple_repeat
5 chr10:11058814-11060583 SINE;DNA
6 chr10:110845092-110847119 SINE;LINE;Simple_repeat
7 chr10:110865305-110866546 SINE
8 chr10:110946871-110947695 LINE
9 chr10:113326142-113327412 SINE
10 chr10:113524679-113525161 SINE
# ℹ 1,156 more rowsH3K27ac_ols$Set_3 %>%
as.data.frame() %>%
group_by(Peakid,repClass) %>%
summarise() %>%
group_by(Peakid) %>% tally %>%
group_by(n) %>% tally# A tibble: 6 × 2
n nn
<int> <int>
1 1 2303
2 2 2054
3 3 974
4 4 317
5 5 67
6 6 9H3K27ac_ols$Set_3 %>%
as.data.frame() %>%
group_by(Peakid) %>%
summarize(.,
repClass=paste0(unique(repClass), collapse=";"))# A tibble: 5,724 × 2
Peakid repClass
<chr> <chr>
1 chr10:100738942-100739973 Simple_repeat
2 chr10:100790295-100791877 Low_complexity;Simple_repeat
3 chr10:101132954-101134846 Simple_repeat
4 chr10:101157763-101159378 RC;LTR
5 chr10:101227112-101229171 Low_complexity;Simple_repeat
6 chr10:101230211-101230842 Simple_repeat
7 chr10:101557797-101558624 SINE
8 chr10:101995380-101996279 LINE
9 chr10:102143712-102144701 LINE
10 chr10:102158807-102161487 SINE;Simple_repeat;LTR
# ℹ 5,714 more rowsAll regions profile
H3K27ac_ols$all_H3K27ac %>%
   as.data.frame() %>%
  group_by(Peakid,repClass) %>%
  summarise() %>%
  group_by(Peakid) %>% tally %>%
  group_by(n) %>% tally
# A tibble: 8 × 2
n nn
<int> <int>
1 1 55458
2 2 41836
3 3 17564
4 4 5519
5 5 1416
6 6 203
7 7 7
8 8 1H3K27ac_ols$all_H3K27ac %>%
as.data.frame() %>%
group_by(Peakid) %>%
summarize(.,
repClass=paste0(unique(repClass), collapse=";"))# A tibble: 122,004 × 2
Peakid repClass
<chr> <chr>
1 chr10:100005111-100005718 LINE;SINE
2 chr10:100006009-100007728 SINE;LINE
3 chr10:100008216-100011014 SINE;Simple_repeat;Unknown;LINE
4 chr10:100043350-100044800 SINE;DNA;Low_complexity
5 chr10:100046129-100046853 LTR;SINE
6 chr10:100179689-100180264 SINE
7 chr10:100184879-100187424 DNA
8 chr10:100199091-100199540 SINE
9 chr10:10020802-10021452 SINE;LTR
10 chr10:100208189-100209822 SINE;LTR
# ℹ 121,994 more rowslength(H3K27ac_sets_gr$all_H3K27ac)[1] 150071H3K27me3 and TEs
H3K27me3_ols <- lapply(H3K27me3_sets_gr, function(df) {
   # 1️⃣ find overlaps
  hits <- findOverlaps(df, rmskr_std_gr)

  # 2️⃣ intersect the overlapping ranges
  overlaps_gr <- pintersect(df[queryHits(hits)], rmskr_std_gr[subjectHits(hits)])

  # 3️⃣ convert to data frame
  overlaps_df <- as.data.frame(overlaps_gr)

  # 4️⃣ add overlap length
  overlaps_df$overlap_bp <- width(overlaps_gr)

  # 5️⃣ ROI lengths & % coverage
  roi_widths <- width(df)
  names(roi_widths) <- df$Peakid
  overlaps_df$roi_len <- roi_widths[as.character(overlaps_df$Peakid)]
  overlaps_df$pct_roi_overlap <- (overlaps_df$overlap_bp / overlaps_df$roi_len) * 100

  # 6️⃣ TE lengths & % coverage
  te_widths <- width(rmskr_std_gr)
  overlaps_df$te_len <- te_widths[subjectHits(hits)]
  overlaps_df$pct_te_overlap <- (overlaps_df$overlap_bp / overlaps_df$te_len) * 100

  # 7️⃣ Add TE metadata from rmsk GRanges
  overlaps_df$repName   <- rmskr_std_gr$repName[subjectHits(hits)]
  overlaps_df$repClass  <- rmskr_std_gr$repClass[subjectHits(hits)]
  overlaps_df$repFamily <- rmskr_std_gr$repFamily[subjectHits(hits)]
  overlaps_df$milliDiv <- rmskr_std_gr$milliDiv[subjectHits(hits)]
  overlaps_df$milliDel <- rmskr_std_gr$milliDel[subjectHits(hits)]
  overlaps_df$milliIns <- rmskr_std_gr$milliIns[subjectHits(hits)]

  overlaps_df
})

rmskr_nonoverlapping_H3K27me3_gr <- rmskr_std_gr[countOverlaps(rmskr_std_gr, H3K27me3_sets_gr[[3]]) == 0]

H3K27me3_ols$Set_1 %>%
  as.data.frame() %>%
  group_by(Peakid,repClass) %>%
  summarise() %>%
  group_by(Peakid) %>% tally %>%
  group_by(n) %>% tally
# A tibble: 8 × 2
n nn
<int> <int>
1 1 59299
2 2 34090
3 3 12830
4 4 5071
5 5 1774
6 6 379
7 7 35
8 8 1H3K27me3_ols$Set_1 %>%
as.data.frame() %>%
group_by(Peakid) %>%
summarize(.,
repClass=paste0(unique(repClass), collapse=";"))# A tibble: 113,479 × 2
Peakid repClass
<chr> <chr>
1 chr10:100046102-100046460 LTR;SINE
2 chr10:100054231-100054520 SINE
3 chr10:100078858-100079126 LINE
4 chr10:100084784-100089581 SINE;LINE;LTR;Low_complexity
5 chr10:100113114-100113630 SINE
6 chr10:100113867-100114131 SINE
7 chr10:100114436-100115458 LINE
8 chr10:100127919-100128315 LTR;LINE
9 chr10:100129022-100129787 LINE;SINE
10 chr10:100229003-100229494 Simple_repeat
# ℹ 113,469 more rowsH3K27me3_ols$Set_2 %>%
as.data.frame() %>%
group_by(Peakid,repClass) %>%
summarise() %>%
group_by(Peakid) %>% tally %>%
group_by(n) %>% tally# A tibble: 3 × 2
n nn
<int> <int>
1 1 104
2 2 41
3 3 8H3K27me3_ols$Set_2 %>%
as.data.frame() %>%
group_by(Peakid) %>%
summarize(.,
repClass=paste0(unique(repClass), collapse=";"))# A tibble: 153 × 2
Peakid repClass
<chr> <chr>
1 chr10:104424708-104425325 LINE;SINE
2 chr10:113524664-113525075 SINE
3 chr10:129076374-129076858 Simple_repeat
4 chr10:130134682-130135251 LINE
5 chr10:132175296-132177004 LINE;Simple_repeat;tRNA
6 chr10:133324189-133324746 Simple_repeat
7 chr10:1398800-1399241 LINE
8 chr10:27256098-27256641 SINE;LTR
9 chr10:29968825-29969238 Simple_repeat
10 chr10:30348778-30349159 Simple_repeat
# ℹ 143 more rowsAll regions profile
H3K27me3_ols$all_H3K27me3 %>%
   as.data.frame() %>%
  group_by(Peakid,repClass) %>%
  summarise() %>%
  group_by(Peakid) %>% tally %>%
  group_by(n) %>% tally
# A tibble: 8 × 2
n nn
<int> <int>
1 1 59987
2 2 34344
3 3 12893
4 4 5078
5 5 1775
6 6 379
7 7 35
8 8 1H3K27me3_ols$all_H3K27me3 %>%
as.data.frame() %>%
group_by(Peakid) %>%
summarize(.,
repClass=paste0(unique(repClass), collapse=";"))# A tibble: 114,492 × 2
Peakid repClass
<chr> <chr>
1 chr10:100046102-100046460 LTR;SINE
2 chr10:100054231-100054520 SINE
3 chr10:100078858-100079126 LINE
4 chr10:100084784-100089581 SINE;LINE;LTR;Low_complexity
5 chr10:100113114-100113630 SINE
6 chr10:100113867-100114131 SINE
7 chr10:100114436-100115458 LINE
8 chr10:100127919-100128315 LTR;LINE
9 chr10:100129022-100129787 LINE;SINE
10 chr10:100229003-100229494 Simple_repeat
# ℹ 114,482 more rowslength(H3K27me3_sets_gr$all_H3K27me3)[1] 150464H3K36me3 and TEs
H3K36me3_ols <- lapply(H3K36me3_sets_gr, function(df) {
  # 1️⃣ find overlaps
  hits <- findOverlaps(df, rmskr_std_gr)

  # 2️⃣ intersect the overlapping ranges
  overlaps_gr <- pintersect(df[queryHits(hits)], rmskr_std_gr[subjectHits(hits)])

  # 3️⃣ convert to data frame
  overlaps_df <- as.data.frame(overlaps_gr)

  # 4️⃣ add overlap length
  overlaps_df$overlap_bp <- width(overlaps_gr)

  # 5️⃣ ROI lengths & % coverage
  roi_widths <- width(df)
  names(roi_widths) <- df$Peakid
  overlaps_df$roi_len <- roi_widths[as.character(overlaps_df$Peakid)]
  overlaps_df$pct_roi_overlap <- (overlaps_df$overlap_bp / overlaps_df$roi_len) * 100

  # 6️⃣ TE lengths & % coverage
  te_widths <- width(rmskr_std_gr)
  overlaps_df$te_len <- te_widths[subjectHits(hits)]
  overlaps_df$pct_te_overlap <- (overlaps_df$overlap_bp / overlaps_df$te_len) * 100

  # 7️⃣ Add TE metadata from rmsk GRanges
  overlaps_df$repName   <- rmskr_std_gr$repName[subjectHits(hits)]
  overlaps_df$repClass  <- rmskr_std_gr$repClass[subjectHits(hits)]
  overlaps_df$repFamily <- rmskr_std_gr$repFamily[subjectHits(hits)]
  overlaps_df$milliDiv <- rmskr_std_gr$milliDiv[subjectHits(hits)]
  overlaps_df$milliDel <- rmskr_std_gr$milliDel[subjectHits(hits)]
  overlaps_df$milliIns <- rmskr_std_gr$milliIns[subjectHits(hits)]

  overlaps_df
})

rmskr_nonoverlapping_H3K36me3_gr <- rmskr_std_gr[countOverlaps(rmskr_std_gr, H3K36me3_sets_gr[[3]]) == 0]


H3K36me3_ols$Set_1 %>%
  as.data.frame() %>%
  group_by(Peakid,repClass) %>%
  summarise() %>%
  group_by(Peakid) %>% tally %>%
  group_by(n) %>% tally
# A tibble: 7 × 2
n nn
<int> <int>
1 1 61918
2 2 24560
3 3 5127
4 4 1062
5 5 192
6 6 22
7 7 1H3K36me3_ols$Set_1 %>%
as.data.frame() %>%
group_by(Peakid) %>%
summarize(.,
repClass=paste0(unique(repClass), collapse=";"))# A tibble: 92,882 × 2
Peakid repClass
<chr> <chr>
1 chr10:100009339-100010339 SINE;Simple_repeat
2 chr10:100139015-100139306 LINE
3 chr10:100147443-100147738 LINE
4 chr10:100196474-100197370 SINE;DNA;LINE
5 chr10:100198988-100199626 SINE
6 chr10:100201468-100201937 DNA;SINE
7 chr10:100202789-100203153 SINE;LINE
8 chr10:100203832-100204198 LTR
9 chr10:100208051-100208777 SINE;LTR
10 chr10:100214861-100215206 LINE;SINE
# ℹ 92,872 more rowsH3K36me3_ols$Set_2 %>%
as.data.frame() %>%
group_by(Peakid,repClass) %>%
summarise() %>%
group_by(Peakid) %>% tally %>%
group_by(n) %>% tally# A tibble: 6 × 2
n nn
<int> <int>
1 1 628
2 2 359
3 3 148
4 4 43
5 5 18
6 6 5H3K36me3_ols$Set_2 %>%
as.data.frame() %>%
group_by(Peakid) %>%
summarize(.,
repClass=paste0(unique(repClass), collapse=";"))# A tibble: 1,201 × 2
Peakid repClass
<chr> <chr>
1 chr10:110729433-110730934 LINE;SINE;Simple_repeat
2 chr10:110803615-110804488 SINE;LTR
3 chr10:114151594-114151957 DNA
4 chr10:117139090-117139567 Simple_repeat
5 chr10:117221071-117221394 DNA
6 chr10:118698372-118698876 SINE;LTR
7 chr10:122207358-122208228 DNA
8 chr10:123157127-123157564 LINE
9 chr10:124613974-124614749 SINE
10 chr10:124670751-124671297 LINE;LTR
# ℹ 1,191 more rowsAll regions profile
H3K36me3_ols$all_H3K36me3 %>%
   as.data.frame() %>%
  group_by(Peakid,repClass) %>%
  summarise() %>%
  group_by(Peakid) %>% tally %>%
  group_by(n) %>% tally
# A tibble: 7 × 2
n nn
<int> <int>
1 1 86790
2 2 34976
3 3 7463
4 4 1502
5 5 284
6 6 39
7 7 3H3K36me3_ols$all_H3K36me3 %>%
as.data.frame() %>%
group_by(Peakid) %>%
summarize(.,
repClass=paste0(unique(repClass), collapse=";"))# A tibble: 131,057 × 2
Peakid repClass
<chr> <chr>
1 chr10:100009339-100010339 SINE;Simple_repeat
2 chr10:100139015-100139306 LINE
3 chr10:100147443-100147738 LINE
4 chr10:100153009-100153887 SINE;LINE
5 chr10:100173135-100173409 DNA
6 chr10:100186943-100187317 DNA
7 chr10:100196474-100197370 SINE;DNA;LINE
8 chr10:100198988-100199626 SINE
9 chr10:100201468-100201937 DNA;SINE
10 chr10:100202789-100203153 SINE;LINE
# ℹ 131,047 more rowslength(H3K36me3_sets_gr$all_H3K36me3)[1] 186724H3K9me3 and TEs
H3K9me3_ols <- lapply(H3K9me3_sets_gr, function(df) {
  # 1️⃣ find overlaps
  hits <- findOverlaps(df, rmskr_std_gr)

  # 2️⃣ intersect the overlapping ranges
  overlaps_gr <- pintersect(df[queryHits(hits)], rmskr_std_gr[subjectHits(hits)])

  # 3️⃣ convert to data frame
  overlaps_df <- as.data.frame(overlaps_gr)

  # 4️⃣ add overlap length
  overlaps_df$overlap_bp <- width(overlaps_gr)

  # 5️⃣ ROI lengths & % coverage
  roi_widths <- width(df)
  names(roi_widths) <- df$Peakid
  overlaps_df$roi_len <- roi_widths[as.character(overlaps_df$Peakid)]
  overlaps_df$pct_roi_overlap <- (overlaps_df$overlap_bp / overlaps_df$roi_len) * 100

  # 6️⃣ TE lengths & % coverage
  te_widths <- width(rmskr_std_gr)
  overlaps_df$te_len <- te_widths[subjectHits(hits)]
  overlaps_df$pct_te_overlap <- (overlaps_df$overlap_bp / overlaps_df$te_len) * 100

  # 7️⃣ Add TE metadata from rmsk GRanges
  overlaps_df$repName   <- rmskr_std_gr$repName[subjectHits(hits)]
  overlaps_df$repClass  <- rmskr_std_gr$repClass[subjectHits(hits)]
  overlaps_df$repFamily <- rmskr_std_gr$repFamily[subjectHits(hits)]
  overlaps_df$milliDiv <- rmskr_std_gr$milliDiv[subjectHits(hits)]
  overlaps_df$milliDel <- rmskr_std_gr$milliDel[subjectHits(hits)]
  overlaps_df$milliIns <- rmskr_std_gr$milliIns[subjectHits(hits)]

  overlaps_df
})

rmskr_nonoverlapping_H3K9me3_gr <- rmskr_std_gr[countOverlaps(rmskr_std_gr, H3K9me3_sets_gr[[4]]) == 0]


H3K9me3_ols$Set_1 %>%
  as.data.frame() %>%
  group_by(Peakid,repClass) %>%
  summarise() %>%
  group_by(Peakid) %>% tally %>%
  group_by(n) %>% tally
# A tibble: 6 × 2
n nn
<int> <int>
1 1 107939
2 2 32414
3 3 4976
4 4 574
5 5 69
6 6 2H3K9me3_ols$Set_1 %>%
as.data.frame() %>%
group_by(Peakid) %>%
summarize(.,
repClass=paste0(unique(repClass), collapse=";"))# A tibble: 145,974 × 2
Peakid repClass
<chr> <chr>
1 chr10:100009524-100010017 Simple_repeat
2 chr10:100025478-100025829 LTR
3 chr10:100027743-100029126 LTR;SINE
4 chr10:100046119-100046433 LTR;SINE
5 chr10:100086477-100087363 LINE;LTR;SINE
6 chr10:100095279-100095524 LINE
7 chr10:100097281-100098436 SINE;LTR
8 chr10:100133860-100134292 LINE;Simple_repeat;LTR
9 chr10:10020906-10021393 SINE;LTR
10 chr10:100229039-100229275 Simple_repeat
# ℹ 145,964 more rowsH3K9me3_ols$Set_2 %>%
as.data.frame() %>%
group_by(Peakid,repClass) %>%
summarise() %>%
group_by(Peakid) %>% tally %>%
group_by(n) %>% tally# A tibble: 4 × 2
n nn
<int> <int>
1 1 1362
2 2 266
3 3 26
4 4 2H3K9me3_ols$Set_2 %>%
as.data.frame() %>%
group_by(Peakid) %>%
summarize(.,
repClass=paste0(unique(repClass), collapse=";"))# A tibble: 1,656 × 2
Peakid repClass
<chr> <chr>
1 chr10:101006128-101006429 SINE
2 chr10:101777876-101778344 LINE
3 chr10:101951337-101951612 SINE
4 chr10:102418095-102418389 Simple_repeat
5 chr10:104329400-104329651 LINE
6 chr10:1101897-1102240 LINE
7 chr10:110227445-110227710 Low_complexity
8 chr10:114786610-114786850 Retroposon
9 chr10:117531528-117532237 SINE
10 chr10:11893983-11894609 SINE
# ℹ 1,646 more rowsH3K9me3_ols$Set_3 %>%
as.data.frame() %>%
group_by(Peakid,repClass) %>%
summarise() %>%
group_by(Peakid) %>% tally %>%
group_by(n) %>% tally# A tibble: 5 × 2
n nn
<int> <int>
1 1 405
2 2 119
3 3 26
4 4 4
5 5 1H3K9me3_ols$Set_3 %>%
as.data.frame() %>%
group_by(Peakid) %>%
summarize(.,
repClass=paste0(unique(repClass), collapse=";"))# A tibble: 555 × 2
Peakid repClass
<chr> <chr>
1 chr10:114252483-114252701 SINE
2 chr10:115903919-115904555 LTR
3 chr10:124611053-124611641 SINE
4 chr10:1298991-1300057 SINE;LTR
5 chr10:1300214-1301077 LINE;SINE
6 chr10:132172535-132172962 LINE;Simple_repeat
7 chr10:132279104-132279514 SINE
8 chr10:132363329-132364326 Simple_repeat
9 chr10:132757314-132757720 DNA
10 chr10:24446759-24447078 SINE
# ℹ 545 more rowsAll regions profile
H3K9me3_ols$all_H3K9me3 %>%
   as.data.frame() %>%
  group_by(Peakid,repClass) %>%
  summarise() %>%
  group_by(Peakid) %>% tally %>%
  group_by(n) %>% tally
# A tibble: 6 × 2
n nn
<int> <int>
1 1 117258
2 2 34507
3 3 5210
4 4 591
5 5 70
6 6 2H3K9me3_ols$all_H3K9me3 %>%
as.data.frame() %>%
group_by(Peakid) %>%
summarize(.,
repClass=paste0(unique(repClass), collapse=";"))# A tibble: 157,638 × 2
Peakid repClass
<chr> <chr>
1 chr10:100006461-100006612 SINE;LINE
2 chr10:100009524-100010017 Simple_repeat
3 chr10:100025478-100025829 LTR
4 chr10:100027743-100029126 LTR;SINE
5 chr10:100046119-100046433 LTR;SINE
6 chr10:100086477-100087363 LINE;LTR;SINE
7 chr10:100095279-100095524 LINE
8 chr10:100097281-100098436 SINE;LTR
9 chr10:100133860-100134292 LINE;Simple_repeat;LTR
10 chr10:10020906-10021393 SINE;LTR
# ℹ 157,628 more rowslength(H3K9me3_sets_gr$all_H3K9me3)[1] 218647Counting TE types:
Below I am setting up the data frames, first I take all regions and annotate with the overlapping dataframe. Then I make new columns, TE_status, SINE_status, LINE_status, LTR_status, DNA_status, SVA_status. These columns mark Peakids if they have this attribute. Last, I am annotating a cluster column to add which set the Peakid exists in by histone. (field will be Set1, Set2, Set3, not_assigned)
All_H3K27ac <- H3K27ac_sets_gr$all_H3K27ac %>% as.data.frame()
All_H3K27me3 <- H3K27me3_sets_gr$all_H3K27me3 %>% as.data.frame()
All_H3K36me3 <- H3K36me3_sets_gr$all_H3K36me3 %>% as.data.frame()
All_H3K9me3 <- H3K9me3_sets_gr$all_H3K9me3 %>% as.data.frame()


H3K27ac_lookup <- imap_dfr(peakAnnoList_H3K27ac[1:3], ~
  tibble(Peakid = .x@anno$Peakid, cluster = .y)
)
H3K27me3_lookup <- imap_dfr(peakAnnoList_H3K27me3[1:2], ~
  tibble(Peakid = .x@anno$Peakid, cluster = .y)
)
H3K36me3_lookup <- imap_dfr(peakAnnoList_H3K36me3[1:2], ~
  tibble(Peakid = .x@anno$Peakid, cluster = .y)
)
H3K9me3_lookup <- imap_dfr(peakAnnoList_H3K9me3[1:3], ~
  tibble(Peakid = .x@anno$Peakid, cluster = .y)
)

annotated_H3K27ac <- All_H3K27ac %>%
  left_join(., (H3K27ac_ols$all_H3K27ac %>%
                  as.data.frame() %>%
                  group_by(Peakid) %>%
                  summarize(.,
                            repClass=paste0(unique(repClass), collapse=";"),
                            repFamily=paste0(unique(repFamily),collapse=";"),
                            repName=paste0(unique(repName),collapse=";"))))%>%
              mutate(TE_status = if_else(is.na(repClass),   "wnot_TE","TE")) %>%
              mutate(SINE_status = case_when(is.na(repClass)~ "wnot_SINE",
                                             str_detect(repClass, "SINE") ~ "SINE",
                                             TRUE ~"wnot_SINE")) %>%
              mutate(LINE_status = case_when(is.na(repClass)~ "wnot_LINE",
                                             str_detect(repClass, "LINE") ~ "LINE",
                                             TRUE ~"wnot_LINE")) %>%
              mutate(LTR_status = case_when(is.na(repClass)~ "wnot_LTR",
                                            str_detect(repClass, "LTR") ~ "LTR",
                                            TRUE ~"wnot_LTR")) %>%
               mutate(DNA_status = case_when(is.na(repClass)~ "wnot_DNA",
                                 str_detect(repClass, "DNA") ~ "DNA",
                                 TRUE ~"wnot_DNA")) %>%
          mutate(SVA_status = case_when(is.na(repClass)~ "wnot_SVA",
                                        str_detect(repClass, "Retroposon") ~ "SVA",
                                        TRUE ~"wnot_SVA")) %>%
  left_join(H3K27ac_lookup, by = "Peakid") %>%
  mutate(cluster = if_else(is.na(cluster), "not_assigned", cluster))


annotated_H3K27me3 <- All_H3K27me3 %>%
  left_join(., (H3K27me3_ols$all_H3K27me3 %>%
                  as.data.frame() %>%
                  group_by(Peakid) %>%
                  summarize(.,
                            repClass=paste0(unique(repClass), collapse=";"),
                            repFamily=paste0(unique(repFamily),collapse=";"),
                            repName=paste0(unique(repName),collapse=";"))))%>%
              mutate(TE_status = if_else(is.na(repClass),   "wnot_TE","TE")) %>%
              mutate(SINE_status = case_when(is.na(repClass)~ "wnot_SINE",
                                             str_detect(repClass, "SINE") ~ "SINE",
                                             TRUE ~"wnot_SINE")) %>%
              mutate(LINE_status = case_when(is.na(repClass)~ "wnot_LINE",
                                             str_detect(repClass, "LINE") ~ "LINE",
                                             TRUE ~"wnot_LINE")) %>%
              mutate(LTR_status = case_when(is.na(repClass)~ "wnot_LTR",
                                            str_detect(repClass, "LTR") ~ "LTR",
                                            TRUE ~"wnot_LTR")) %>%
               mutate(DNA_status = case_when(is.na(repClass)~ "wnot_DNA",
                                 str_detect(repClass, "DNA") ~ "DNA",
                                 TRUE ~"wnot_DNA")) %>%
          mutate(SVA_status = case_when(is.na(repClass)~ "wnot_SVA",
                                        str_detect(repClass, "Retroposon") ~ "SVA",
                                        TRUE ~"wnot_SVA")) %>%
  left_join(H3K27me3_lookup, by = "Peakid") %>%
  mutate(cluster = if_else(is.na(cluster), "not_assigned", cluster))


annotated_H3K36me3 <- All_H3K36me3 %>%
  left_join(., (H3K36me3_ols$all_H3K36me3 %>%
                  as.data.frame() %>%
                  group_by(Peakid) %>%
                  summarize(.,
                            repClass=paste0(unique(repClass), collapse=";"),
                            repFamily=paste0(unique(repFamily),collapse=";"),
                            repName=paste0(unique(repName),collapse=";"))))%>%
              mutate(TE_status = if_else(is.na(repClass),   "wnot_TE","TE")) %>%
              mutate(SINE_status = case_when(is.na(repClass)~ "wnot_SINE",
                                             str_detect(repClass, "SINE") ~ "SINE",
                                             TRUE ~"wnot_SINE")) %>%
              mutate(LINE_status = case_when(is.na(repClass)~ "wnot_LINE",
                                             str_detect(repClass, "LINE") ~ "LINE",
                                             TRUE ~"wnot_LINE")) %>%
              mutate(LTR_status = case_when(is.na(repClass)~ "wnot_LTR",
                                            str_detect(repClass, "LTR") ~ "LTR",
                                            TRUE ~"wnot_LTR")) %>%
               mutate(DNA_status = case_when(is.na(repClass)~ "wnot_DNA",
                                 str_detect(repClass, "DNA") ~ "DNA",
                                 TRUE ~"wnot_DNA")) %>%
          mutate(SVA_status = case_when(is.na(repClass)~ "wnot_SVA",
                                        str_detect(repClass, "Retroposon") ~ "SVA",
                                        TRUE ~"wnot_SVA")) %>%
  left_join(H3K36me3_lookup, by = "Peakid") %>%
  mutate(cluster = if_else(is.na(cluster), "not_assigned", cluster))


annotated_H3K9me3 <- All_H3K9me3 %>%
  left_join(., (H3K9me3_ols$all_H3K9me3 %>%
                  as.data.frame() %>%
                  group_by(Peakid) %>%
                  summarize(.,
                            repClass=paste0(unique(repClass), collapse=";"),
                            repFamily=paste0(unique(repFamily),collapse=";"),
                            repName=paste0(unique(repName),collapse=";"))))%>%
              mutate(TE_status = if_else(is.na(repClass),   "wnot_TE","TE")) %>%
              mutate(SINE_status = case_when(is.na(repClass)~ "wnot_SINE",
                                             str_detect(repClass, "SINE") ~ "SINE",
                                             TRUE ~"wnot_SINE")) %>%
              mutate(LINE_status = case_when(is.na(repClass)~ "wnot_LINE",
                                             str_detect(repClass, "LINE") ~ "LINE",
                                             TRUE ~"wnot_LINE")) %>%
              mutate(LTR_status = case_when(is.na(repClass)~ "wnot_LTR",
                                            str_detect(repClass, "LTR") ~ "LTR",
                                            TRUE ~"wnot_LTR")) %>%
               mutate(DNA_status = case_when(is.na(repClass)~ "wnot_DNA",
                                 str_detect(repClass, "DNA") ~ "DNA",
                                 TRUE ~"wnot_DNA")) %>%
          mutate(SVA_status = case_when(is.na(repClass)~ "wnot_SVA",
                                        str_detect(repClass, "Retroposon") ~ "SVA",
                                        TRUE ~"wnot_SVA")) %>%
  left_join(H3K9me3_lookup, by = "Peakid") %>%
  mutate(cluster = if_else(is.na(cluster), "not_assigned", cluster))

# annotated_tables <- list("annotated_H3K27ac"=annotated_H3K27ac,
#                          "annotated_H3K27me3"=annotated_H3K27me3,
#                          "annotated_H3K36me3"=annotated_H3K36me3,
#                          "annotated_H3K9me3"=annotated_H3K9me3)
#
# saveRDS(annotated_tables,"data/TE_annotation/annotated_tables_1bp_ol.RDS")
Counts of regions in each set
H3K27ac_data <- data.frame("total"=length(All_H3K27ac$Peakid),"Set1"=length(H3K27ac_lookup$cluster[H3K27ac_lookup$cluster=="Set_1"]),"Set2"=length(H3K27ac_lookup$cluster[H3K27ac_lookup$cluster=="Set_2"]),"Set3"=length(H3K27ac_lookup$cluster[H3K27ac_lookup$cluster=="Set_3"]))

H3K9me3_data <- data.frame("total"=length(All_H3K9me3$Peakid),"Set1"=length(H3K9me3_lookup$cluster[H3K9me3_lookup$cluster=="Set_1"]),"Set2"=length(H3K9me3_lookup$cluster[H3K9me3_lookup$cluster=="Set_2"]),"Set3"=length(H3K9me3_lookup$cluster[H3K9me3_lookup$cluster=="Set_3"]))

H3K27me3_data <- data.frame("total"=length(All_H3K27me3$Peakid),"Set1"=length(H3K27me3_lookup$cluster[H3K27me3_lookup$cluster=="Set_1"]),"Set2"=length(H3K27me3_lookup$cluster[H3K27me3_lookup$cluster=="Set_2"]),"Set3"=length(H3K27me3_lookup$cluster[H3K27me3_lookup$cluster=="Set_3"]))

H3K36me3_data <- data.frame("total"=length(All_H3K36me3$Peakid),"Set1"=length(H3K36me3_lookup$cluster[H3K36me3_lookup$cluster=="Set_1"]),"Set2"=length(H3K36me3_lookup$cluster[H3K36me3_lookup$cluster=="Set_2"]),"Set3"=length(H3K36me3_lookup$cluster[H3K36me3_lookup$cluster=="Set_3"]))

Region_dataframe <- bind_rows(list(H3K27ac=H3K27ac_data, H3K27me3=H3K27me3_data, H3K36me3=H3K36me3_data, H3K9me3=H3K9me3_data), .id="histone")

datatable(Region_dataframe)
50% counting histones
annotated_H3K27ac_50_per <- All_H3K27ac %>%
  left_join(., (H3K27ac_ols$all_H3K27ac %>%
                  as.data.frame() %>%
                  dplyr::filter(pct_te_overlap>50) %>%
                  group_by(Peakid) %>%
                  summarize(.,
                            repClass=paste0(unique(repClass[pct_te_overlap>50]), collapse=";"),
                            repFamily=paste0(unique(repFamily[pct_te_overlap>50]),collapse=";"),
                            repName=paste0(unique(repName[pct_te_overlap>50]),collapse=";"))))%>%
              mutate(TE_status = if_else(is.na(repClass),   "wnot_TE","TE")) %>%
              mutate(SINE_status = case_when(is.na(repClass)~ "wnot_SINE",
                                             str_detect(repClass, "SINE") ~ "SINE",
                                             TRUE ~"wnot_SINE")) %>%
              mutate(LINE_status = case_when(is.na(repClass)~ "wnot_LINE",
                                             str_detect(repClass, "LINE") ~ "LINE",
                                             TRUE ~"wnot_LINE")) %>%
              mutate(LTR_status = case_when(is.na(repClass)~ "wnot_LTR",
                                            str_detect(repClass, "LTR") ~ "LTR",
                                            TRUE ~"wnot_LTR")) %>%
               mutate(DNA_status = case_when(is.na(repClass)~ "wnot_DNA",
                                 str_detect(repClass, "DNA") ~ "DNA",
                                 TRUE ~"wnot_DNA")) %>%
          mutate(SVA_status = case_when(is.na(repClass)~ "wnot_SVA",
                                        str_detect(repClass, "Retroposon") ~ "SVA",
                                        TRUE ~"wnot_SVA")) %>%
  left_join(H3K27ac_lookup, by = "Peakid") %>%
  mutate(cluster = if_else(is.na(cluster), "not_assigned", cluster))


annotated_H3K27me3_50_per <- All_H3K27me3 %>%
  left_join(., (H3K27me3_ols$all_H3K27me3 %>%
                  as.data.frame() %>%
                  dplyr::filter(pct_te_overlap>50) %>%
                  group_by(Peakid) %>%
                  summarize(.,
                            repClass=paste0(unique(repClass[pct_te_overlap>50]), collapse=";"),
                            repFamily=paste0(unique(repFamily[pct_te_overlap>50]),collapse=";"),
                            repName=paste0(unique(repName[pct_te_overlap>50]),collapse=";"))))%>%
              mutate(TE_status = if_else(is.na(repClass),   "wnot_TE","TE")) %>%
              mutate(SINE_status = case_when(is.na(repClass)~ "wnot_SINE",
                                             str_detect(repClass, "SINE") ~ "SINE",
                                             TRUE ~"wnot_SINE")) %>%
              mutate(LINE_status = case_when(is.na(repClass)~ "wnot_LINE",
                                             str_detect(repClass, "LINE") ~ "LINE",
                                             TRUE ~"wnot_LINE")) %>%
              mutate(LTR_status = case_when(is.na(repClass)~ "wnot_LTR",
                                            str_detect(repClass, "LTR") ~ "LTR",
                                            TRUE ~"wnot_LTR")) %>%
               mutate(DNA_status = case_when(is.na(repClass)~ "wnot_DNA",
                                 str_detect(repClass, "DNA") ~ "DNA",
                                 TRUE ~"wnot_DNA")) %>%
          mutate(SVA_status = case_when(is.na(repClass)~ "wnot_SVA",
                                        str_detect(repClass, "Retroposon") ~ "SVA",
                                        TRUE ~"wnot_SVA")) %>%
  left_join(H3K27me3_lookup, by = "Peakid") %>%
  mutate(cluster = if_else(is.na(cluster), "not_assigned", cluster))


annotated_H3K36me3_50_per <- All_H3K36me3 %>%
  left_join(., (H3K36me3_ols$all_H3K36me3 %>%
                  as.data.frame() %>%
                  dplyr::filter(pct_te_overlap>50) %>%
                  group_by(Peakid) %>%
                  summarize(.,
                            repClass=paste0(unique(repClass[pct_te_overlap>50]), collapse=";"),
                            repFamily=paste0(unique(repFamily[pct_te_overlap>50]),collapse=";"),
                            repName=paste0(unique(repName[pct_te_overlap>50]),collapse=";"))))%>%
              mutate(TE_status = if_else(is.na(repClass),   "wnot_TE","TE")) %>%
              mutate(SINE_status = case_when(is.na(repClass)~ "wnot_SINE",
                                             str_detect(repClass, "SINE") ~ "SINE",
                                             TRUE ~"wnot_SINE")) %>%
              mutate(LINE_status = case_when(is.na(repClass)~ "wnot_LINE",
                                             str_detect(repClass, "LINE") ~ "LINE",
                                             TRUE ~"wnot_LINE")) %>%
              mutate(LTR_status = case_when(is.na(repClass)~ "wnot_LTR",
                                            str_detect(repClass, "LTR") ~ "LTR",
                                            TRUE ~"wnot_LTR")) %>%
               mutate(DNA_status = case_when(is.na(repClass)~ "wnot_DNA",
                                 str_detect(repClass, "DNA") ~ "DNA",
                                 TRUE ~"wnot_DNA")) %>%
          mutate(SVA_status = case_when(is.na(repClass)~ "wnot_SVA",
                                        str_detect(repClass, "Retroposon") ~ "SVA",
                                        TRUE ~"wnot_SVA")) %>%
  left_join(H3K36me3_lookup, by = "Peakid") %>%
  mutate(cluster = if_else(is.na(cluster), "not_assigned", cluster))


annotated_H3K9me3_50_per <- All_H3K9me3 %>%
  left_join(., (H3K9me3_ols$all_H3K9me3 %>%
                  as.data.frame() %>%
                  dplyr::filter(pct_te_overlap>50) %>%
                  group_by(Peakid) %>%
                  summarize(.,
                            repClass=paste0(unique(repClass[pct_te_overlap>50]), collapse=";"),
                            repFamily=paste0(unique(repFamily[pct_te_overlap>50]),collapse=";"),
                            repName=paste0(unique(repName[pct_te_overlap>50]),collapse=";"))))%>%
              mutate(TE_status = if_else(is.na(repClass),   "wnot_TE","TE")) %>%
              mutate(SINE_status = case_when(is.na(repClass)~ "wnot_SINE",
                                             str_detect(repClass, "SINE") ~ "SINE",
                                             TRUE ~"wnot_SINE")) %>%
              mutate(LINE_status = case_when(is.na(repClass)~ "wnot_LINE",
                                             str_detect(repClass, "LINE") ~ "LINE",
                                             TRUE ~"wnot_LINE")) %>%
              mutate(LTR_status = case_when(is.na(repClass)~ "wnot_LTR",
                                            str_detect(repClass, "LTR") ~ "LTR",
                                            TRUE ~"wnot_LTR")) %>%
               mutate(DNA_status = case_when(is.na(repClass)~ "wnot_DNA",
                                 str_detect(repClass, "DNA") ~ "DNA",
                                 TRUE ~"wnot_DNA")) %>%
          mutate(SVA_status = case_when(is.na(repClass)~ "wnot_SVA",
                                        str_detect(repClass, "Retroposon") ~ "SVA",
                                        TRUE ~"wnot_SVA")) %>%
  left_join(H3K9me3_lookup, by = "Peakid") %>%
  mutate(cluster = if_else(is.na(cluster), "not_assigned", cluster))


# annotated_tables_50_per <- list("annotated_H3K27ac_50_per"=annotated_H3K27ac_50_per,
#                          "annotated_H3K27me3_50_per"=annotated_H3K27me3_50_per,
#                          "annotated_H3K36me3_50_per"=annotated_H3K36me3_50_per,
#                          "annotated_H3K9me3_50_per"=annotated_H3K9me3_50_per)
#
# saveRDS(annotated_tables_50_per,"data/TE_annotation/annotated_tables_50per_ol.RDS")
te_cols <- c("TE_status","SINE_status","LINE_status","DNA_status","LTR_status","SVA_status")
H3K27ac_counts <- map(te_cols, ~ {
annotated_H3K27ac %>%
group_by(cluster, !!sym(.x)) %>% # dynamically use column
tally() %>%
pivot_wider(
id_cols = cluster,
names_from = !!sym(.x),
values_from = n
)
}) %>% set_names(te_cols)
H3K27ac_counts_long <- map2_dfr(
H3K27ac_counts, # the named list of wide tables
names(H3K27ac_counts), # names of TE columns
~ .x %>%
pivot_longer(
cols = -cluster, # everything except 'cluster'
names_to = "status", # new column for TE status (e.g., TE / wnot_TE)
values_to = "count"
) %>%
mutate(TE_type = .y) # add TE_type column based on list element name
)
H3K27ac_counts_long <- H3K27ac_counts_long %>%
group_by(TE_type) %>%
tidyr::complete(cluster, status, fill = list(count = 0)) %>%
ungroup()
H3K27me3_counts <- map(te_cols, ~ {
annotated_H3K27me3 %>%
group_by(cluster, !!sym(.x)) %>% # dynamically use column
tally() %>%
pivot_wider(
id_cols = cluster,
names_from = !!sym(.x),
values_from = n
)
}) %>% set_names(te_cols)
H3K27me3_counts_long <- map2_dfr(
H3K27me3_counts, # the named list of wide tables
names(H3K27me3_counts), # names of TE columns
~ .x %>%
pivot_longer(
cols = -cluster, # everything except 'cluster'
names_to = "status", # new column for TE status (e.g., TE / not_TE)
values_to = "count"
) %>%
mutate(TE_type = .y) # add TE_type column based on list element name
)
H3K27me3_counts_long <- H3K27me3_counts_long %>%
group_by(TE_type) %>%
tidyr::complete(cluster, status, fill = list(count = 0)) %>%
ungroup()
H3K36me3_counts <- map(te_cols, ~ {
annotated_H3K36me3 %>%
group_by(cluster, !!sym(.x)) %>% # dynamically use column
tally() %>%
pivot_wider(
id_cols = cluster,
names_from = !!sym(.x),
values_from = n
)
}) %>% set_names(te_cols)
H3K36me3_counts_long <- map2_dfr(
H3K36me3_counts, # the named list of wide tables
names(H3K36me3_counts), # names of TE columns
~ .x %>%
pivot_longer(
cols = -cluster, # everything except 'cluster'
names_to = "status", # new column for TE status (e.g., TE / not_TE)
values_to = "count"
) %>%
mutate(TE_type = .y) # add TE_type column based on list element name
)
H3K36me3_counts_long <- H3K36me3_counts_long %>%
group_by(TE_type) %>%
tidyr::complete(cluster, status, fill = list(count = 0)) %>%
ungroup()
H3K9me3_counts <- map(te_cols, ~ {
annotated_H3K9me3 %>%
group_by(cluster, !!sym(.x)) %>% # dynamically use column
tally() %>%
pivot_wider(
id_cols = cluster,
names_from = !!sym(.x),
values_from = n
)
}) %>% set_names(te_cols)
H3K9me3_counts_long <- map2_dfr(
H3K9me3_counts, # the named list of wide tables
names(H3K9me3_counts), # names of TE columns
~ .x %>%
pivot_longer(
cols = -cluster, # everything except 'cluster'
names_to = "status", # new column for TE status (e.g., TE / wnot_TE)
values_to = "count"
) %>%
mutate(TE_type = .y) # add TE_type column based on list element name
)
H3K9me3_counts_long <- H3K9me3_counts_long %>%
group_by(TE_type) %>%
tidyr::complete(cluster, status, fill = list(count = 0)) %>%
ungroup()te_cols <- c("TE_status","SINE_status","LINE_status","DNA_status","LTR_status","SVA_status")
H3K27ac_counts_50per <- map(te_cols, ~ {
annotated_H3K27ac_50_per %>%
group_by(cluster, !!sym(.x)) %>% # dynamically use column
tally() %>%
pivot_wider(
id_cols = cluster,
names_from = !!sym(.x),
values_from = n
)
}) %>% set_names(te_cols)
H3K27ac_counts_long_50per <- map2_dfr(
H3K27ac_counts_50per, # the named list of wide tables
names(H3K27ac_counts_50per), # names of TE columns
~ .x %>%
pivot_longer(
cols = -cluster, # everything except 'cluster'
names_to = "status", # new column for TE status (e.g., TE / wnot_TE)
values_to = "count"
) %>%
mutate(TE_type = .y) # add TE_type column based on list element name
)
H3K27ac_counts_long_50per <- H3K27ac_counts_long_50per %>%
group_by(TE_type) %>%
tidyr::complete(cluster, status, fill = list(count = 0)) %>%
ungroup()
H3K27me3_counts_50per <- map(te_cols, ~ {
annotated_H3K27me3_50_per %>%
group_by(cluster, !!sym(.x)) %>% # dynamically use column
tally() %>%
pivot_wider(
id_cols = cluster,
names_from = !!sym(.x),
values_from = n
)
}) %>% set_names(te_cols)
H3K27me3_counts_long_50per <- map2_dfr(
H3K27me3_counts_50per, # the named list of wide tables
names(H3K27me3_counts_50per), # names of TE columns
~ .x %>%
pivot_longer(
cols = -cluster, # everything except 'cluster'
names_to = "status", # new column for TE status (e.g., TE / not_TE)
values_to = "count"
) %>%
mutate(TE_type = .y) # add TE_type column based on list element name
)
H3K27me3_counts_long_50per <- H3K27me3_counts_long_50per %>%
group_by(TE_type) %>%
tidyr::complete(cluster, status, fill = list(count = 0)) %>%
ungroup()
H3K36me3_counts_50per <- map(te_cols, ~ {
annotated_H3K36me3_50_per %>%
group_by(cluster, !!sym(.x)) %>% # dynamically use column
tally() %>%
pivot_wider(
id_cols = cluster,
names_from = !!sym(.x),
values_from = n
)
}) %>% set_names(te_cols)
H3K36me3_counts_long_50per <- map2_dfr(
H3K36me3_counts_50per, # the named list of wide tables
names(H3K36me3_counts_50per), # names of TE columns
~ .x %>%
pivot_longer(
cols = -cluster, # everything except 'cluster'
names_to = "status", # new column for TE status (e.g., TE / not_TE)
values_to = "count"
) %>%
mutate(TE_type = .y) # add TE_type column based on list element name
)
H3K36me3_counts_long_50per <- H3K36me3_counts_long_50per %>%
group_by(TE_type) %>%
tidyr::complete(cluster, status, fill = list(count = 0)) %>%
ungroup()
H3K9me3_counts_50per <- map(te_cols, ~ {
annotated_H3K9me3_50_per %>%
group_by(cluster, !!sym(.x)) %>% # dynamically use column
tally() %>%
pivot_wider(
id_cols = cluster,
names_from = !!sym(.x),
values_from = n
)
}) %>% set_names(te_cols)
H3K9me3_counts_long_50per <- map2_dfr(
H3K9me3_counts_50per, # the named list of wide tables
names(H3K9me3_counts_50per), # names of TE columns
~ .x %>%
pivot_longer(
cols = -cluster, # everything except 'cluster'
names_to = "status", # new column for TE status (e.g., TE / wnot_TE)
values_to = "count"
) %>%
mutate(TE_type = .y) # add TE_type column based on list element name
)
H3K9me3_counts_long_50per <- H3K9me3_counts_long_50per %>%
group_by(TE_type) %>%
tidyr::complete(cluster, status, fill = list(count = 0)) %>%
ungroup()making the function
# # function to test enrichment for one TE type, one cluster pair
# test_pair_TE <- function(df_long, te_name, cluster1, cluster2) {
#
#   # filter for TE type
#   sub_df <- df_long %>% filter(TE_type == te_name)
#
#   # get counts for cluster1 and cluster2
#   c1 <- sub_df %>% dplyr::filter(cluster == cluster1)
#   c2 <- sub_df %>% dplyr::filter(cluster == cluster2)
#
#   # 2x2 table: rows = clusters, cols = TE / wnot_TE
#   mat <- matrix(
#     c(c2$count, sum(c2$count) - c2$count,
#       c1$count, sum(c1$count) - c1$count),
#     nrow = 2,
#     byrow = TRUE,
#     dimnames = list(
#       cluster = c(cluster2, cluster1),
#       category = c("TE", "wnot_TE")
#     )
#   )
#
#   ft <- fisher.test(mat)
#
#   tibble(
#     TE_type     = te_name,
#     comparison  = paste(cluster2, "vs", cluster1),
#     odds_ratio  = ft$estimate,
#     lower_CI    = ft$conf.int[1],
#     upper_CI    = ft$conf.int[2],
#     p_value     = ft$p.value
#   )
# }


# Generic pairwise Fisher test
test_pair_TE_generic <- function(df_long, te_name, cluster1, cluster2) {

  sub_df <- df_long %>% filter(TE_type == te_name)

  # assume "status" column has TE vs wnot_TE automatically
  statuses <- unique(sub_df$status)

  if(length(statuses) != 2) {
    # ensure we have exactly two categories, fill missing with 0
    sub_df <- sub_df %>%
      complete(cluster, status, fill = list(count = 0))
    statuses <- unique(sub_df$status)
  }

  # extract counts for cluster1
  c1_counts <- sub_df %>%
    filter(cluster == cluster1) %>%
    arrange(match(status, statuses)) %>%   # ensure same order
    pull(count)

  # extract counts for cluster2
  c2_counts <- sub_df %>%
    filter(cluster == cluster2) %>%
    arrange(match(status, statuses)) %>%
    pull(count)

  # build 2x2 matrix
  mat <- matrix(
    c(c2_counts, c1_counts),
    nrow = 2,
    byrow = TRUE,
    dimnames = list(
      cluster = c(cluster2, cluster1),
      category = statuses
    )
  )

  ft <- tryCatch(
    fisher.test(mat, workspace = 2e8),
    error = function(e) fisher.test(mat, simulate.p.value = TRUE, B = 1e5)
  )

  tibble(
    TE_type     = te_name,
    comparison  = paste(cluster2, "vs", cluster1),
    odds_ratio  = ft$estimate,
    lower_CI    = ft$conf.int[1],
    upper_CI    = ft$conf.int[2],
    p_value     = ft$p.value
  )
}
applying to dataframes
H3K27ac proportions
results for 1bp overlap H3K27ac
TE_types <- te_cols

cluster_pairs_3 <- list(
  c("Set_2","Set_1"),
  c("Set_3","Set_1")
  # add more pairs if needed or
)
cluster_pairs_2 <- list(
  c("Set_2","Set_1"))


H3K27ac_results_1bp <- map_dfr(TE_types, function(te){
  map_dfr(cluster_pairs_3, function(pair){
    test_pair_TE_generic(H3K27ac_counts_long, te, cluster1 = pair[2], cluster2 = pair[1])
  })
})

htmltools::tagList(
  htmltools::h3("H3K27ac odds ratio 1bp"),
datatable(H3K27ac_results_1bp,options = list(
    scrollY = "600px",
    scrollCollapse = TRUE,
    pageLength = 20,
    autoWidth = TRUE
  ),
  rownames = FALSE))
H3K27ac odds ratio 1bp
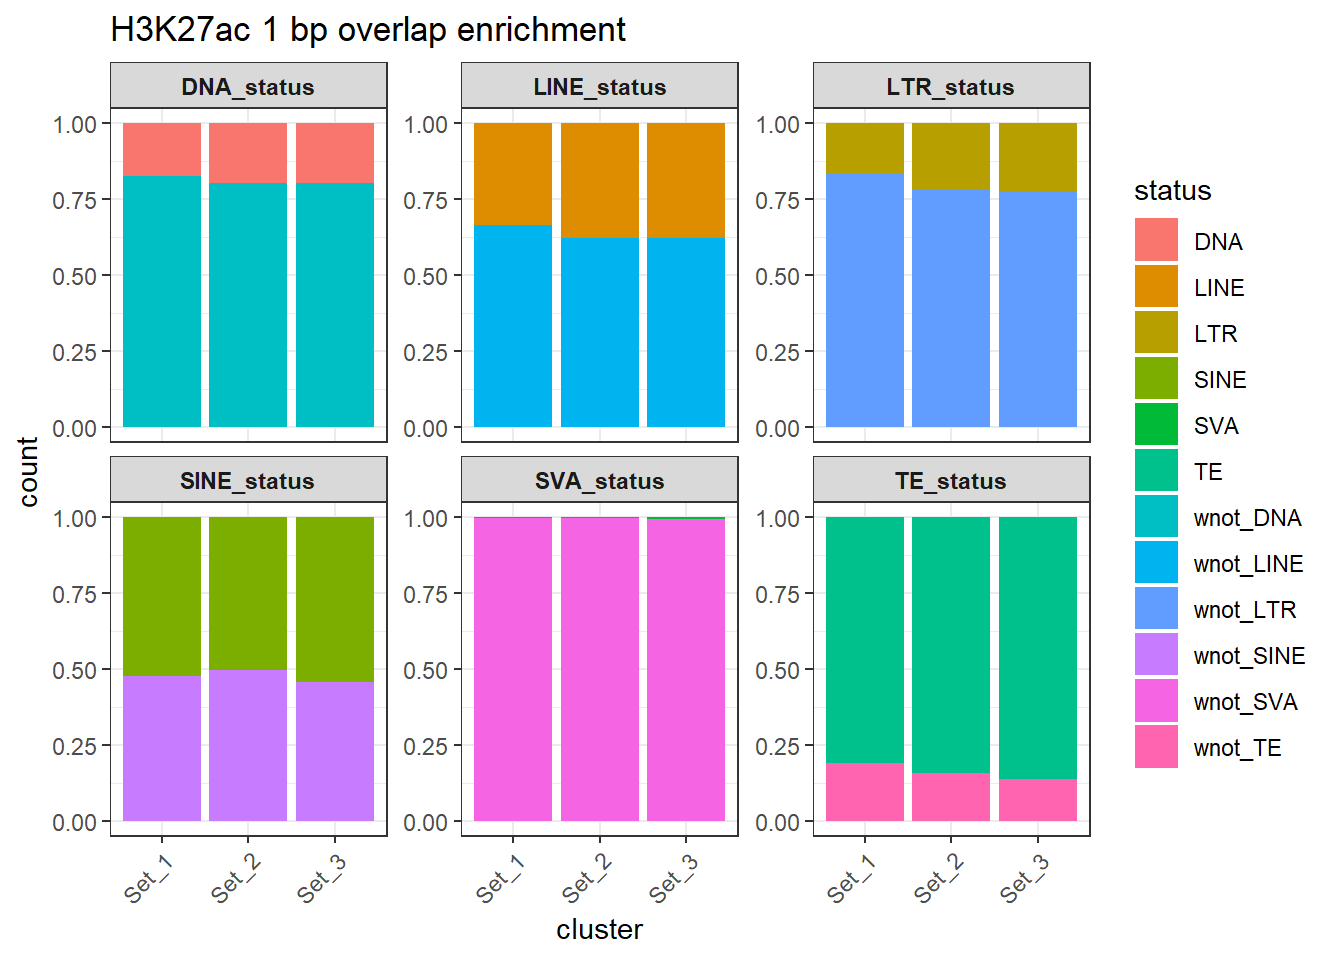
H3K27ac_counts_long %>%
  dplyr::filter(cluster != "not_assigned") %>%
  ggplot(aes(x=cluster, y=count, fill=status)) +
  geom_bar(stat="identity", position = "fill") +
  facet_wrap(~TE_type, scales="free_y")+
  ggtitle("H3K27ac 1 bp overlap enrichment")+
  theme_bw() +
  theme(
    axis.text.x = element_text(angle = 45, hjust = 1),
    strip.text = element_text(face = "bold")
  )
| Version | Author | Date |
|---|---|---|
| 967b7a8 | reneeisnowhere | 2025-09-16 |
H3K27ac_results_1bp %>%
  mutate(TE_label=str_remove(TE_type,"_status$")) %>%
  ggplot(., aes(x = (odds_ratio), y = -log10(p_value),label = TE_label)) +
  geom_point(aes(color = odds_ratio > 1), size = 3) +
   # geom_text_repel(data = subset(SVA_results, FDR < 0.05)) +
  geom_text_repel(size=3, max.overlaps = Inf)+
  geom_hline(yintercept = -log10(0.05), linetype = "dashed") +
  labs(
    x = "(Odds Ratio)",
    y = "-log10(FDR)",
    title = "TE class enrichment at ROIs\nH3K27ac"
  ) +
  theme_classic() +
  facet_wrap(~comparison)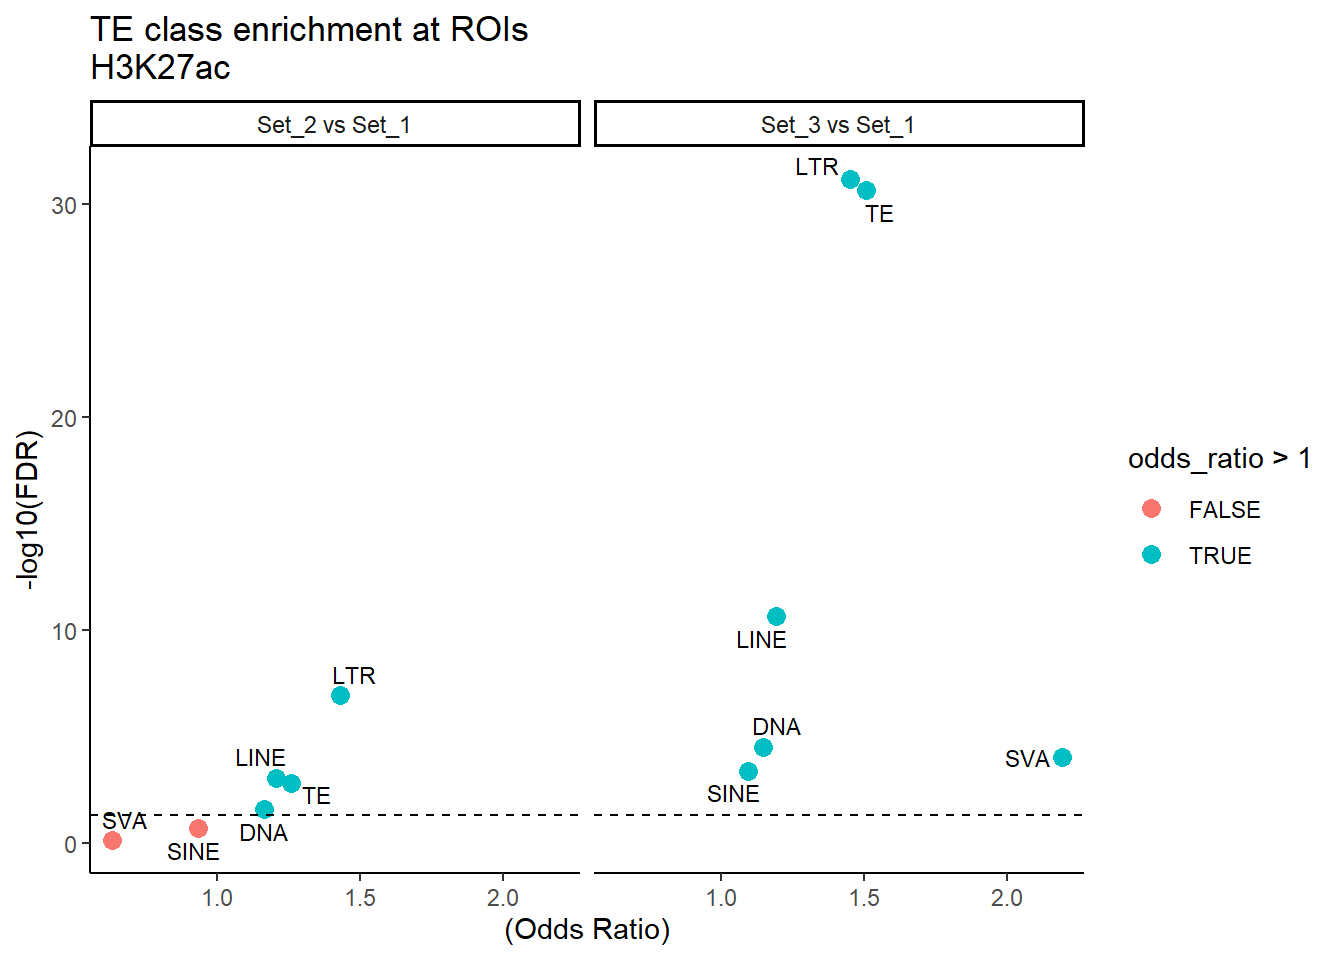
results for 50% TE overlap H3K27ac
###
H3K27ac_results_50per <- map_dfr(TE_types, function(te){
  map_dfr(cluster_pairs_3, function(pair){
    test_pair_TE_generic(H3K27ac_counts_long_50per, te, cluster1 = pair[2], cluster2 = pair[1])
  })
})

htmltools::tagList(
  htmltools::h3("H3K27ac odds ratio >50% overlap results"),
datatable(H3K27ac_results_50per,
          options = list(
    scrollY = "600px",
    scrollCollapse = TRUE,
    pageLength = 20,
    autoWidth = TRUE
  ),
  rownames = FALSE))
H3K27ac odds ratio >50% overlap results
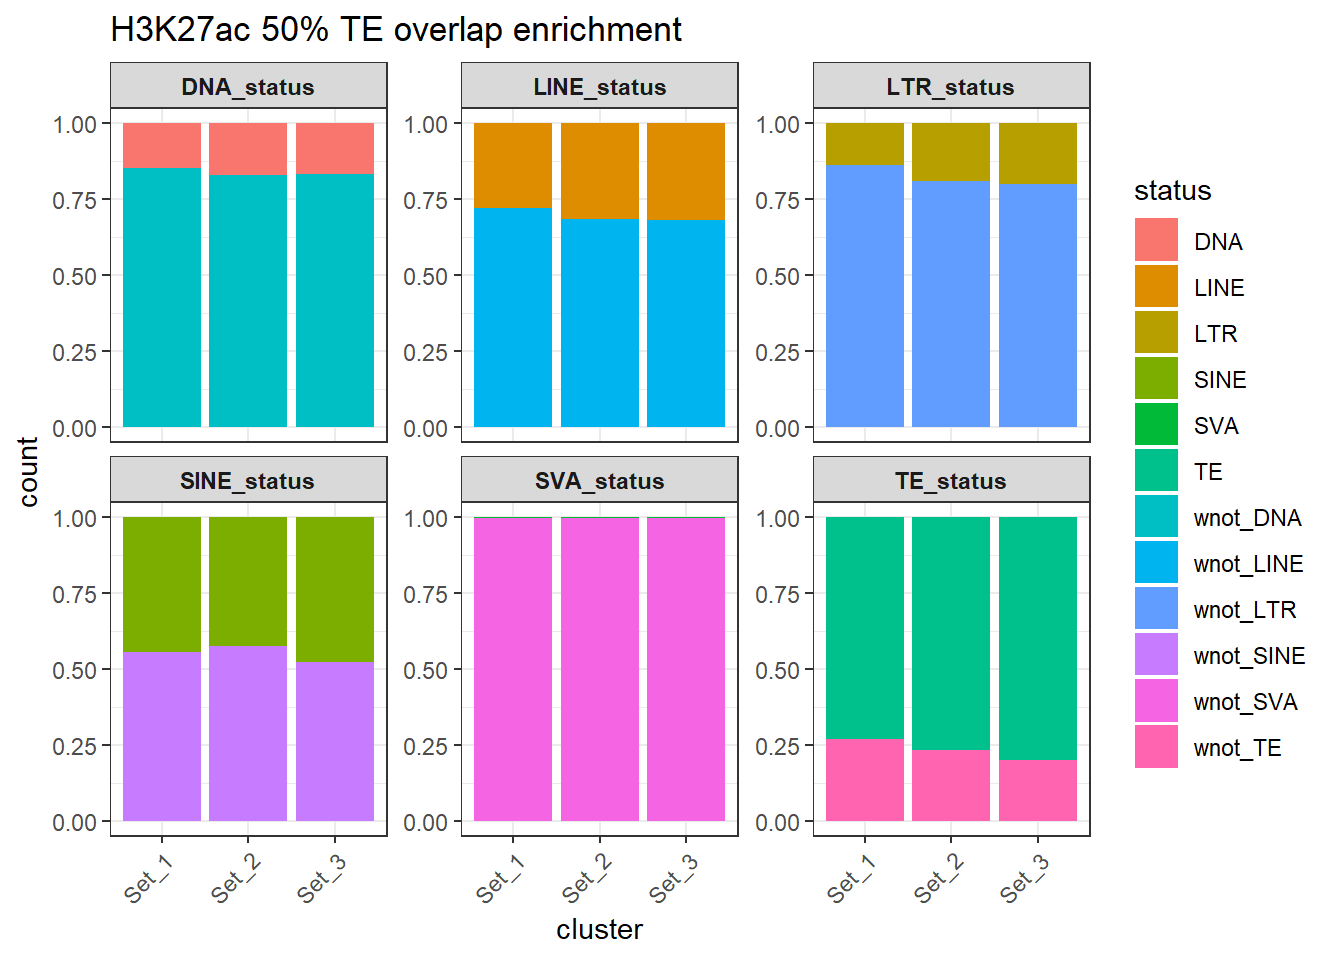
H3K27ac_counts_long_50per %>%
  dplyr::filter(cluster != "not_assigned") %>%
  ggplot(aes(x=cluster, y=count, fill=status)) +
  geom_bar(stat="identity", position = "fill") +
  facet_wrap(~TE_type, scales="free_y")+
  ggtitle("H3K27ac 50% TE overlap enrichment")+
  theme_bw() +
  theme(
    axis.text.x = element_text(angle = 45, hjust = 1),
    strip.text = element_text(face = "bold")
  )
| Version | Author | Date |
|---|---|---|
| 967b7a8 | reneeisnowhere | 2025-09-16 |
  H3K27ac_results_50per %>%
  mutate(TE_label=str_remove(TE_type,"_status$")) %>%
  ggplot(., aes(x = (odds_ratio), y = -log10(p_value),label = TE_label)) +
  geom_point(aes(color = odds_ratio > 1), size = 3) +
   # geom_text_repel(data = subset(SVA_results, FDR < 0.05)) +
  geom_text_repel(size=3, max.overlaps = Inf)+
  geom_hline(yintercept = -log10(0.05), linetype = "dashed") +
  labs(
    x = "(Odds Ratio)",
    y = "-log10(FDR)",
    title = "TE class enrichment at ROIs\nH3K27ac 50%"
  ) +
  theme_classic() +
  facet_wrap(~comparison)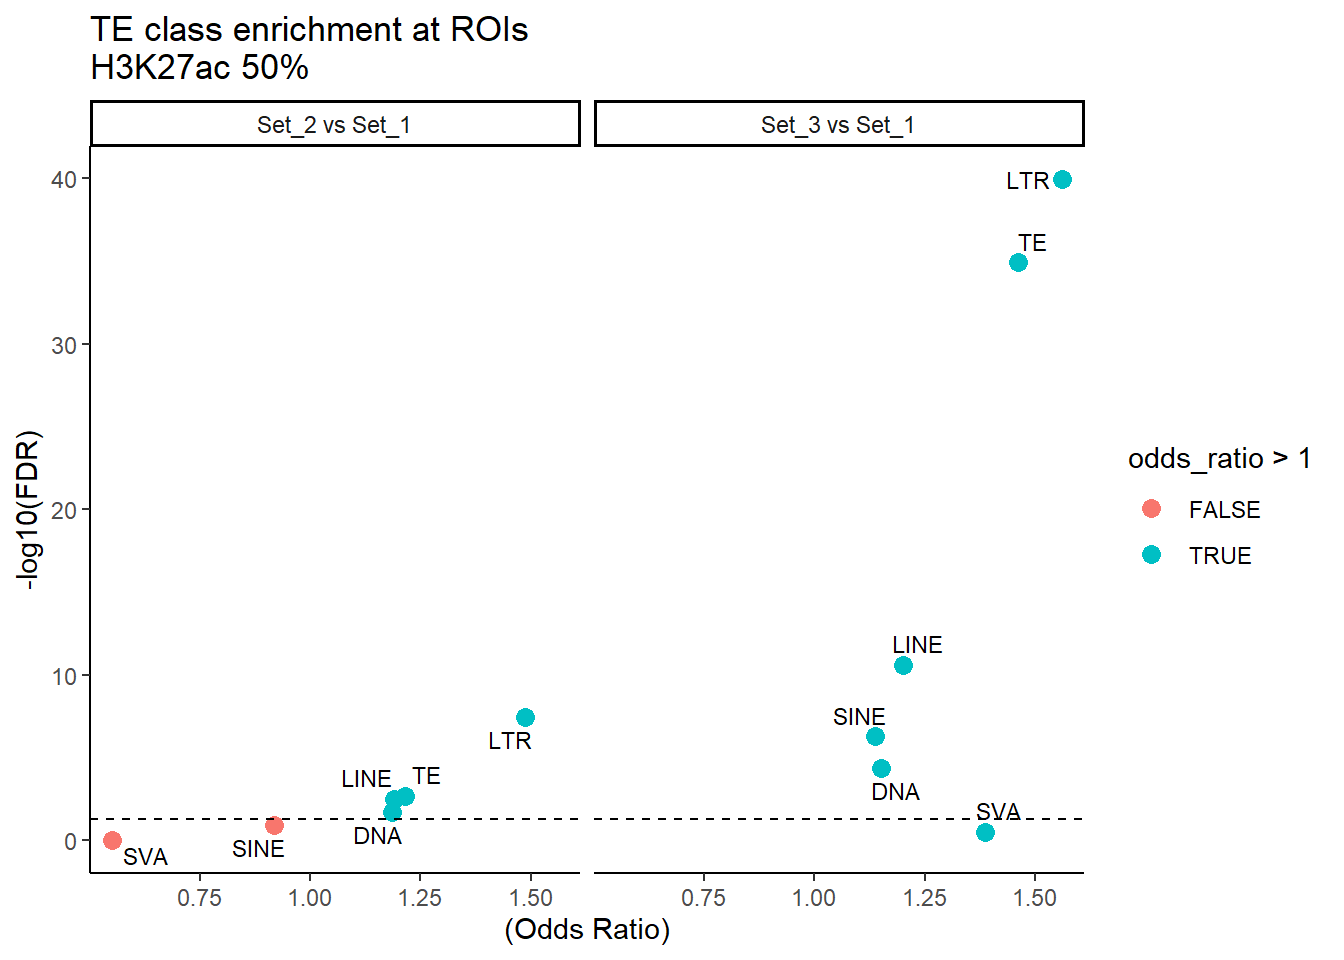
H3K27me3 proportions
results for 1bp overlap H3K27me3
H3K27me3_results_1bp <- map_dfr(TE_types, function(te){
  map_dfr(cluster_pairs_2, function(pair){
    test_pair_TE_generic(H3K27me3_counts_long, te, cluster1 = pair[2], cluster2 = pair[1])
  })
})

htmltools::tagList(
  htmltools::h3("H3K27me3 odds ratio 1bp"),
datatable(H3K27me3_results_1bp,options = list(
    scrollY = "600px",
    scrollCollapse = TRUE,
    pageLength = 20,
    autoWidth = TRUE
  ),
  rownames = FALSE))
H3K27me3 odds ratio 1bp
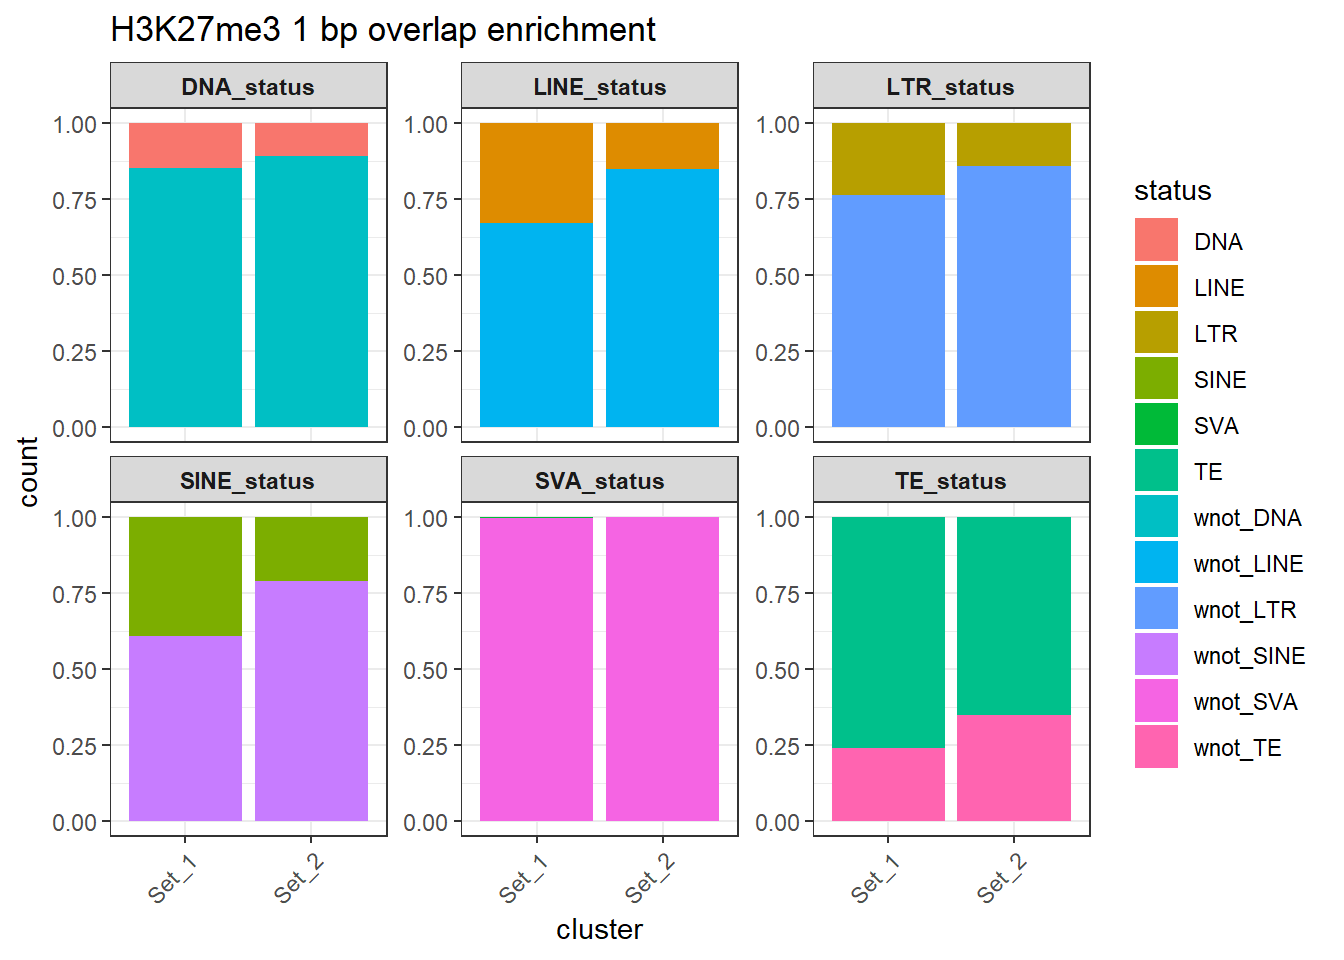
H3K27me3_counts_long %>%
  dplyr::filter(cluster != "not_assigned") %>%
  ggplot(aes(x=cluster, y=count, fill=status)) +
  geom_bar(stat="identity", position = "fill") +
  facet_wrap(~TE_type, scales="free_y")+
  ggtitle("H3K27me3 1 bp overlap enrichment")+
  theme_bw() +
  theme(
    axis.text.x = element_text(angle = 45, hjust = 1),
    strip.text = element_text(face = "bold")
  )
| Version | Author | Date |
|---|---|---|
| 967b7a8 | reneeisnowhere | 2025-09-16 |
H3K27me3_results_1bp %>%
  mutate(TE_label=str_remove(TE_type,"_status$")) %>%
  ggplot(., aes(x = (odds_ratio), y = -log10(p_value),label = TE_label)) +
  geom_point(aes(color = odds_ratio > 1), size = 3) +
   # geom_text_repel(data = subset(SVA_results, FDR < 0.05)) +
  geom_text_repel(size=3, max.overlaps = Inf)+
  geom_hline(yintercept = -log10(0.05), linetype = "dashed") +
  labs(
    x = "(Odds Ratio)",
    y = "-log10(FDR)",
    title = "TE class enrichment at ROIs\nH3K27me3"
  ) +
  theme_classic() +
  facet_wrap(~comparison)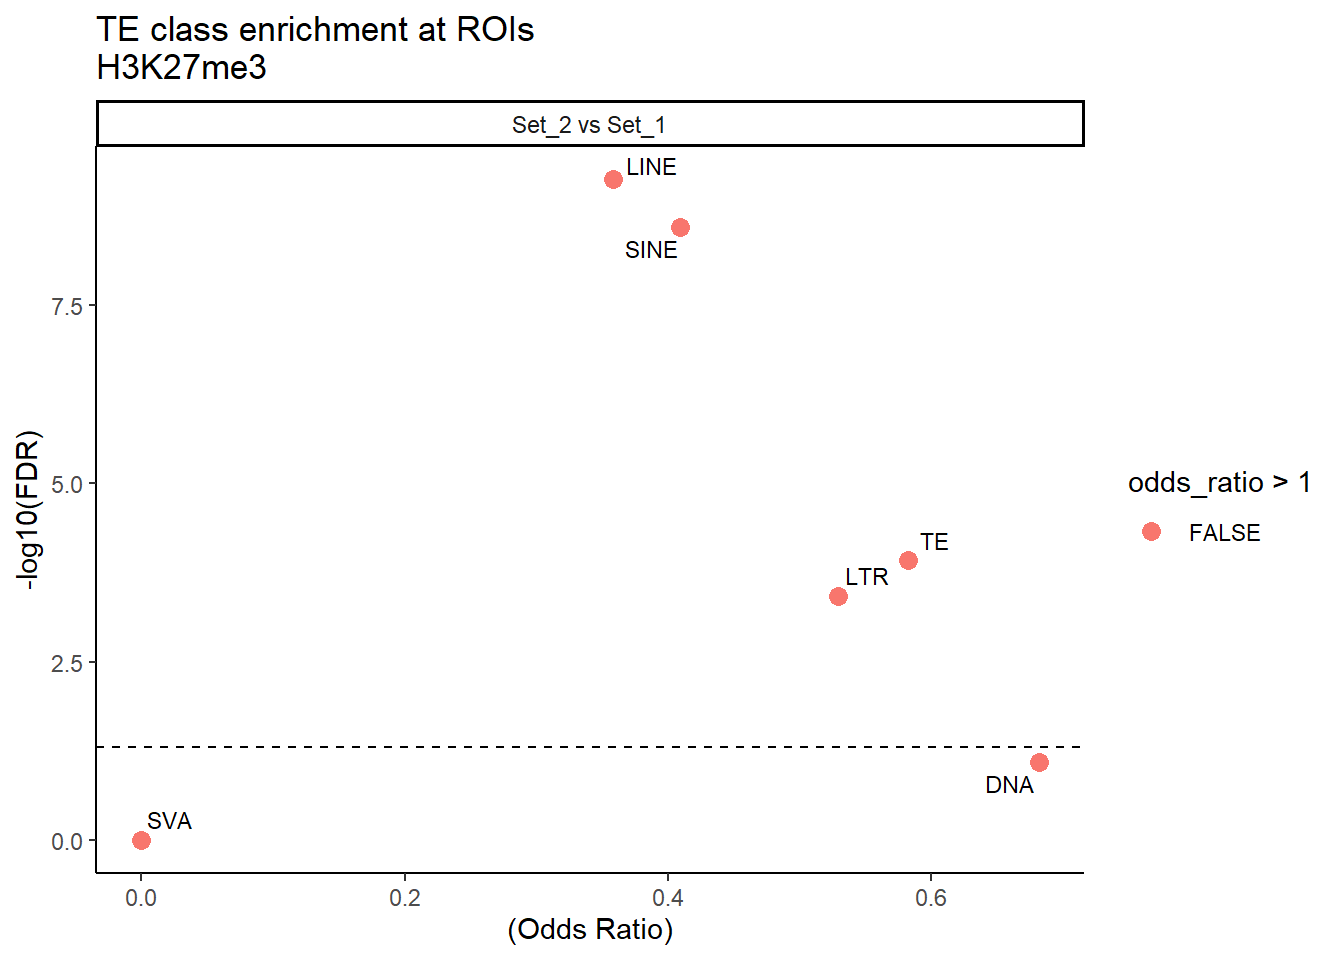
results for 50% TE overlap H3K27me3
###
H3K27me3_results_50per <- map_dfr(TE_types, function(te){
  map_dfr(cluster_pairs_2, function(pair){
    test_pair_TE_generic(H3K27me3_counts_long_50per, te, cluster1 = pair[2], cluster2 = pair[1])
  })
})

htmltools::tagList(
  htmltools::h3("H3K27me3 odds ratio >50% overlap results"),
datatable(H3K27me3_results_50per,options = list(
    scrollY = "600px",
    scrollCollapse = TRUE,
    pageLength = 20,
    autoWidth = TRUE
  ),
  rownames = FALSE))
H3K27me3 odds ratio >50% overlap results
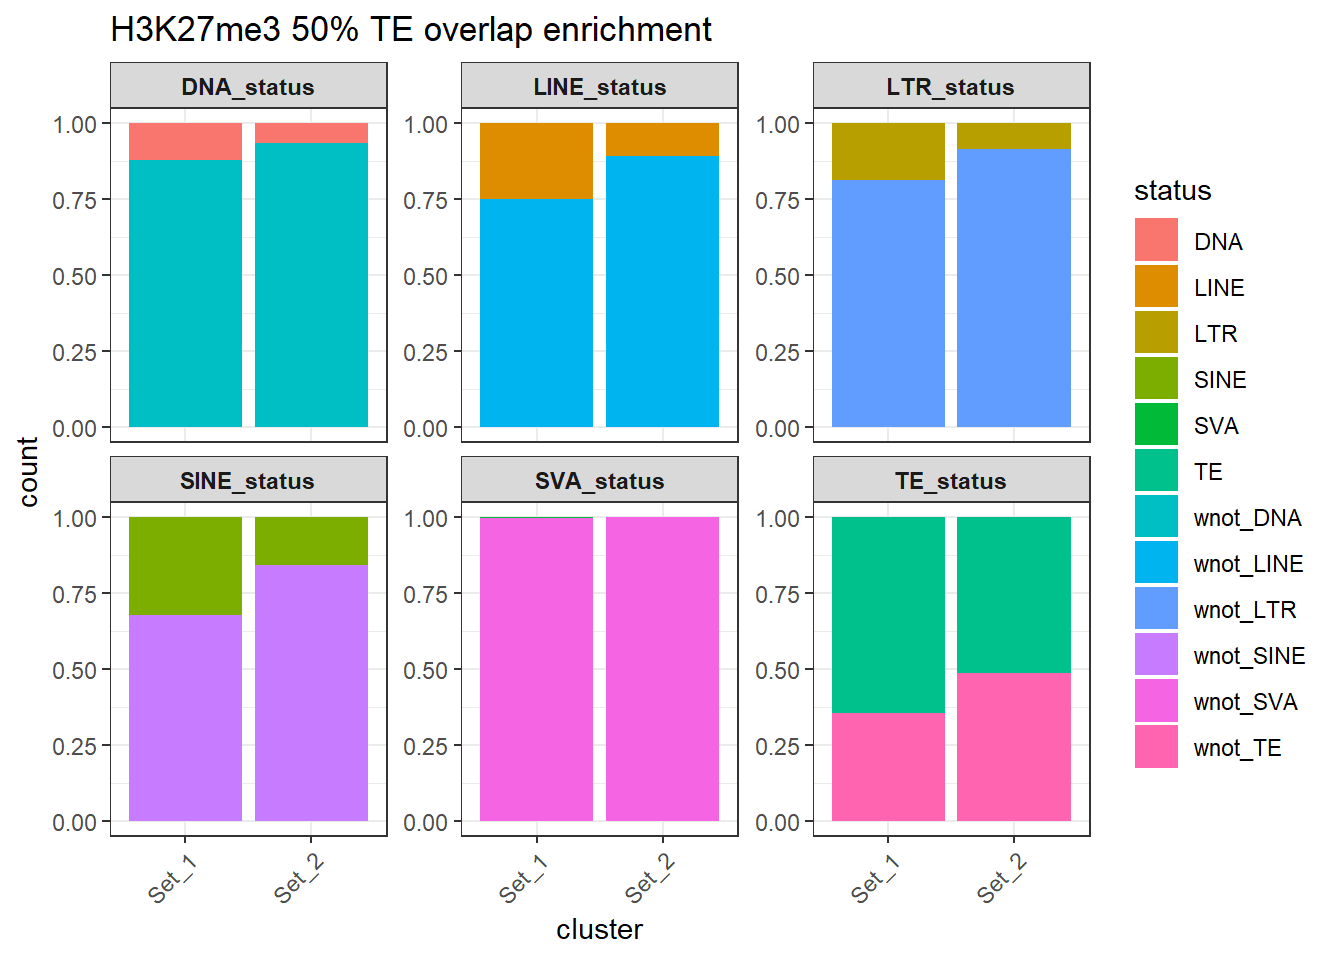
H3K27me3_counts_long_50per %>%
  dplyr::filter(cluster != "not_assigned") %>%
  ggplot(aes(x=cluster, y=count, fill=status)) +
  geom_bar(stat="identity", position = "fill") +
  facet_wrap(~TE_type, scales="free_y")+
  ggtitle("H3K27me3 50% TE overlap enrichment")+
  theme_bw() +
  theme(
    axis.text.x = element_text(angle = 45, hjust = 1),
    strip.text = element_text(face = "bold")
  )
| Version | Author | Date |
|---|---|---|
| 967b7a8 | reneeisnowhere | 2025-09-16 |
  H3K27me3_results_50per %>%
  mutate(TE_label=str_remove(TE_type,"_status$")) %>%
  ggplot(., aes(x = (odds_ratio), y = -log10(p_value),label = TE_label)) +
  geom_point(aes(color = odds_ratio > 1), size = 3) +
   # geom_text_repel(data = subset(SVA_results, FDR < 0.05)) +
  geom_text_repel(size=3, max.overlaps = Inf)+
  geom_hline(yintercept = -log10(0.05), linetype = "dashed") +
  labs(
    x = "(Odds Ratio)",
    y = "-log10(FDR)",
    title = "TE class enrichment at ROIs\nH3K27me3 50%"
  ) +
  theme_classic() +
  facet_wrap(~comparison)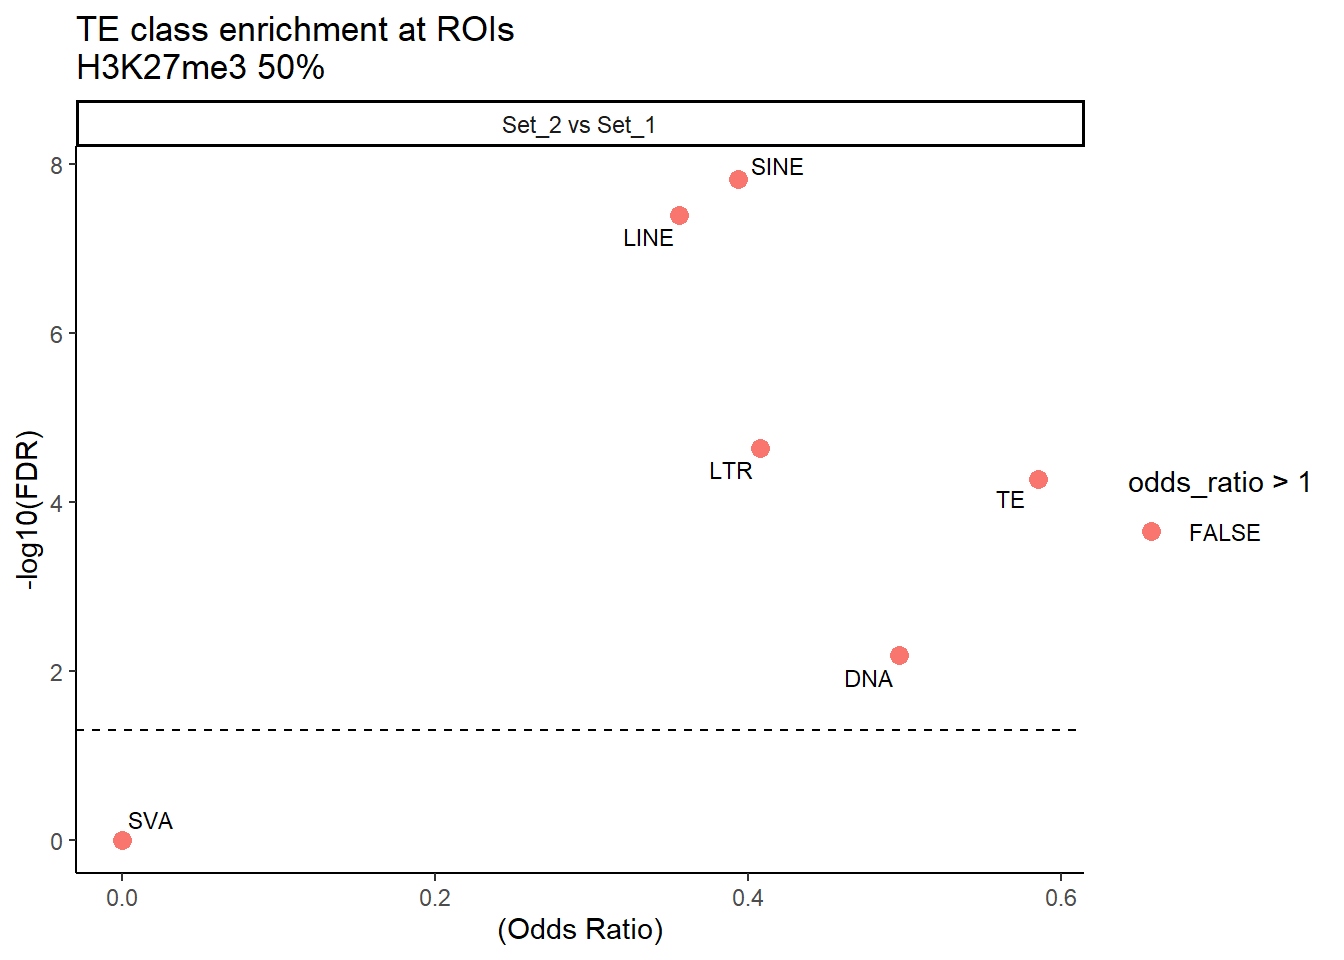
H3K36me3 proportions
results for 1bp overlap H3K36me3
H3K36me3_results_1bp <- map_dfr(TE_types, function(te){
  map_dfr(cluster_pairs_2, function(pair){
    test_pair_TE_generic(H3K36me3_counts_long, te, cluster1 = pair[2], cluster2 = pair[1])
  })
})

htmltools::tagList(
  htmltools::h3("H3K36me3 odds ratio 1bp result"),
datatable(H3K36me3_results_1bp,options = list(
    scrollY = "600px",
    scrollCollapse = TRUE,
    pageLength = 20,
    autoWidth = TRUE
  ),
  rownames = FALSE))
H3K36me3 odds ratio 1bp result
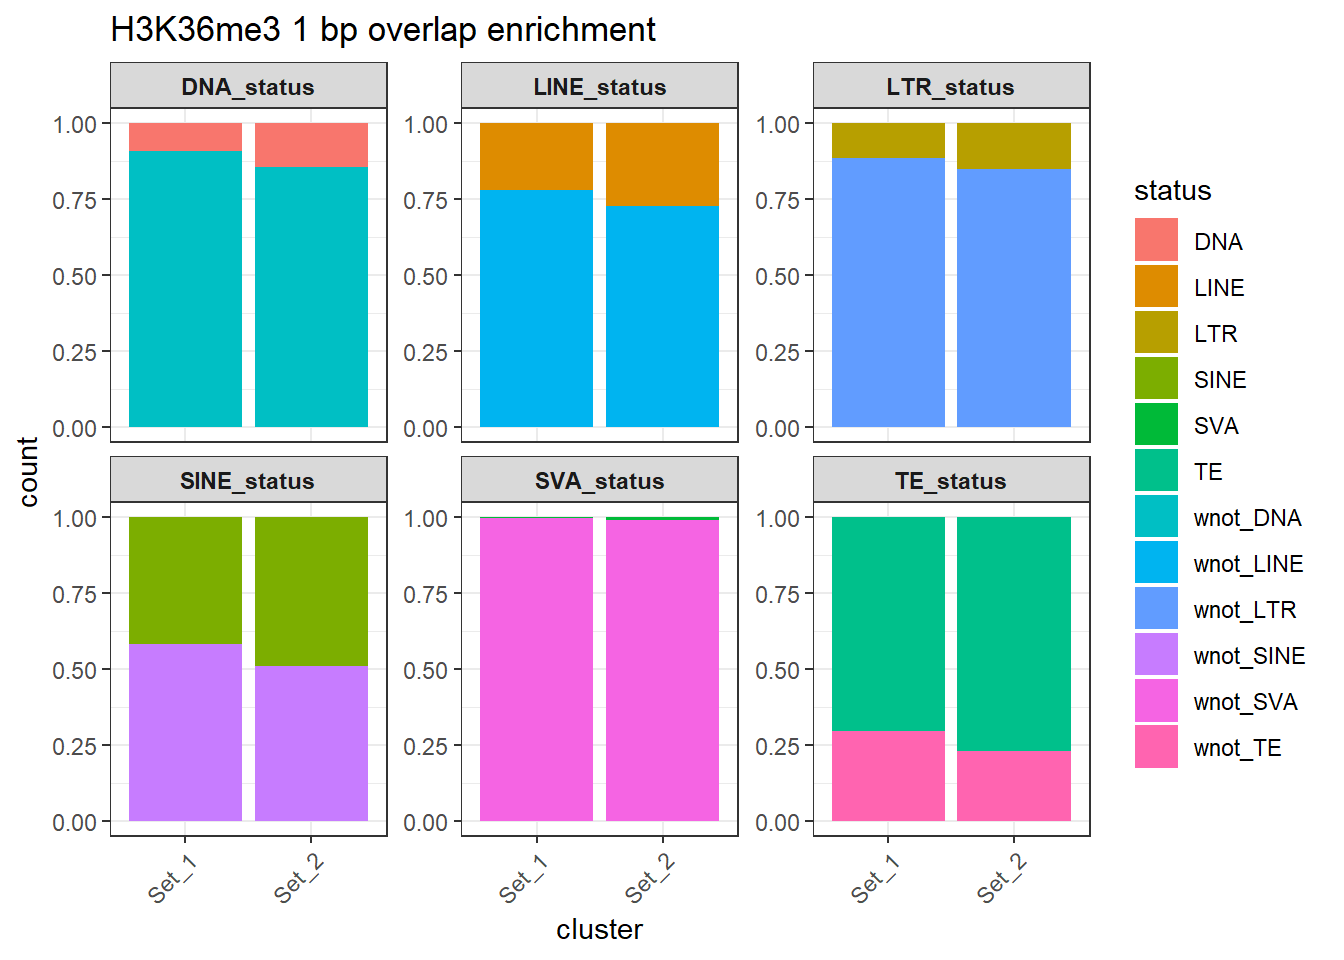
H3K36me3_counts_long %>%
  dplyr::filter(cluster != "not_assigned") %>%
  ggplot(aes(x=cluster, y=count, fill=status)) +
  geom_bar(stat="identity", position = "fill") +
  facet_wrap(~TE_type, scales="free_y")+
  ggtitle("H3K36me3 1 bp overlap enrichment")+
  theme_bw() +
  theme(
    axis.text.x = element_text(angle = 45, hjust = 1),
    strip.text = element_text(face = "bold")
  )
| Version | Author | Date |
|---|---|---|
| 967b7a8 | reneeisnowhere | 2025-09-16 |
H3K36me3_results_1bp %>%
  mutate(TE_label=str_remove(TE_type,"_status$")) %>%
  ggplot(., aes(x = (odds_ratio), y = -log10(p_value),label = TE_label)) +
  geom_point(aes(color = odds_ratio > 1), size = 3) +
   # geom_text_repel(data = subset(SVA_results, FDR < 0.05)) +
  geom_text_repel(size=3, max.overlaps = Inf)+
  geom_hline(yintercept = -log10(0.05), linetype = "dashed") +
  labs(
    x = "(Odds Ratio)",
    y = "-log10(FDR)",
    title = "TE class enrichment at ROIs\nH3K36me3"
  ) +
  theme_classic() +
  facet_wrap(~comparison)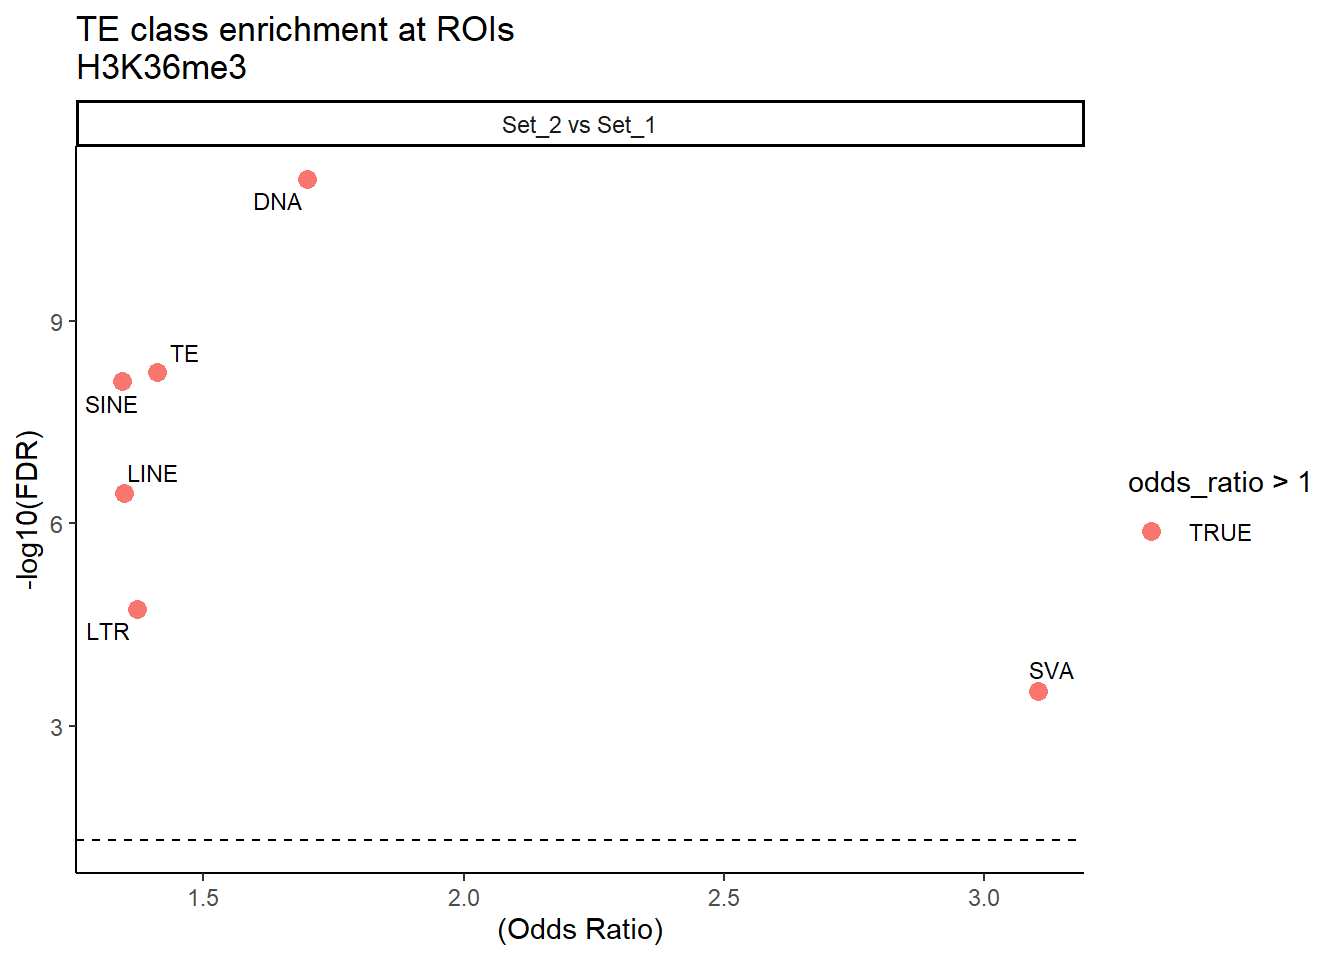
results for 50% TE overlap H3K36me3
###
H3K36me3_results_50per <- map_dfr(TE_types, function(te){
  map_dfr(cluster_pairs_2, function(pair){
    test_pair_TE_generic(H3K36me3_counts_long_50per, te, cluster1 = pair[2], cluster2 = pair[1])
  })
})

htmltools::tagList(
  htmltools::h3("H3K36me3 odds ratio >50% overlap results"),
datatable(H3K36me3_results_50per,options = list(
    scrollY = "600px",
    scrollCollapse = TRUE,
    pageLength = 20,
    autoWidth = TRUE
  ),
  rownames = FALSE))
H3K36me3 odds ratio >50% overlap results
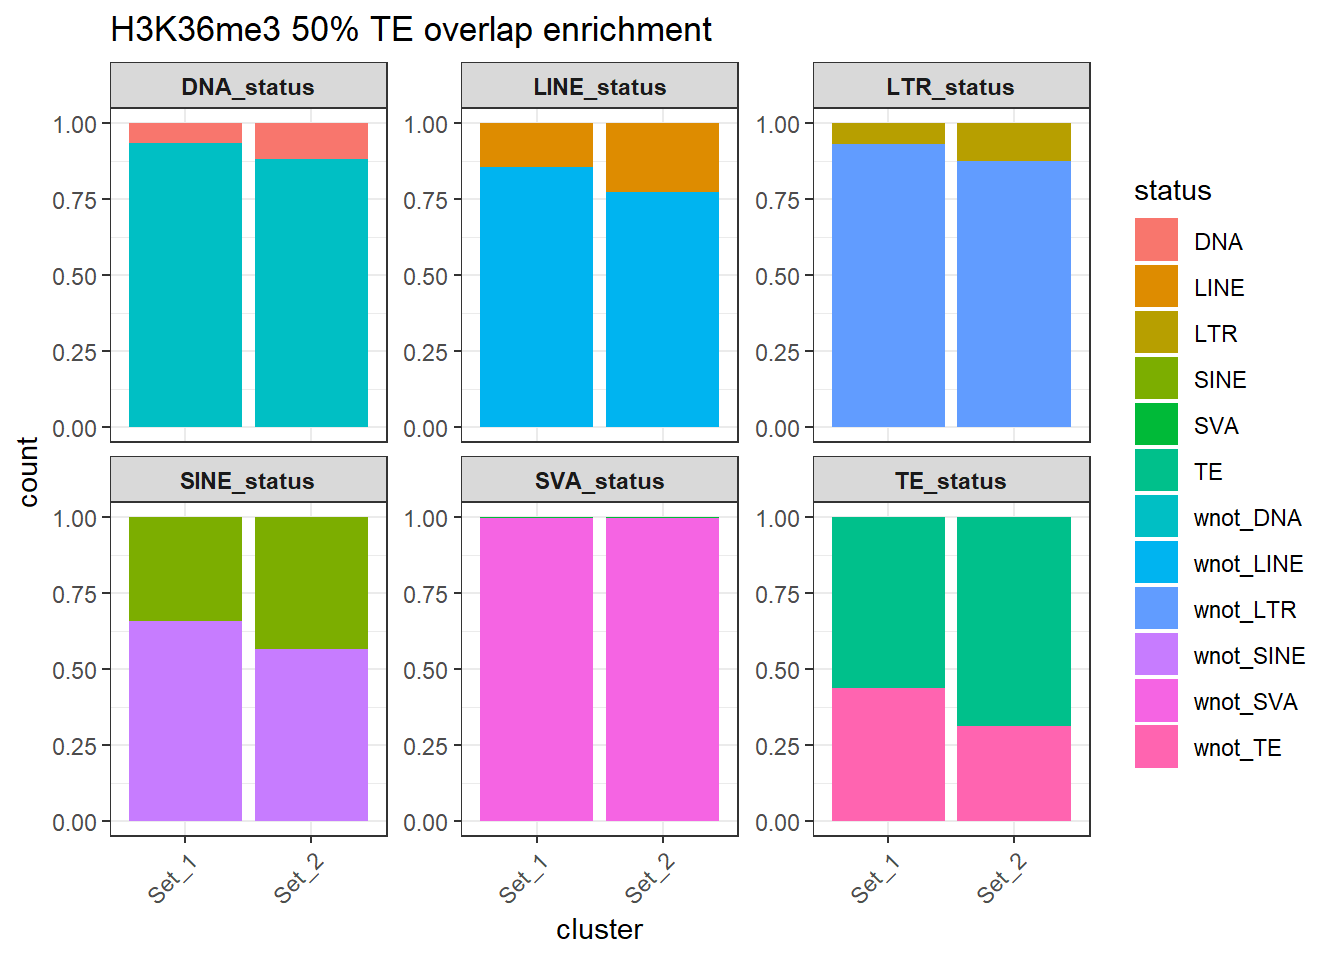
H3K36me3_counts_long_50per %>%
  dplyr::filter(cluster != "not_assigned") %>%
  ggplot(aes(x=cluster, y=count, fill=status)) +
  geom_bar(stat="identity", position = "fill") +
  facet_wrap(~TE_type, scales="free_y")+
  ggtitle("H3K36me3 50% TE overlap enrichment")+
  theme_bw() +
  theme(
    axis.text.x = element_text(angle = 45, hjust = 1),
    strip.text = element_text(face = "bold")
  )
| Version | Author | Date |
|---|---|---|
| 967b7a8 | reneeisnowhere | 2025-09-16 |
H3K36me3_results_50per %>%
  mutate(TE_label=str_remove(TE_type,"_status$")) %>%
  ggplot(., aes(x = (odds_ratio), y = -log10(p_value),label = TE_label)) +
  geom_point(aes(color = odds_ratio > 1), size = 3) +
   # geom_text_repel(data = subset(SVA_results, FDR < 0.05)) +
  geom_text_repel(size=3, max.overlaps = Inf)+
  geom_hline(yintercept = -log10(0.05), linetype = "dashed") +
  labs(
    x = "(Odds Ratio)",
    y = "-log10(FDR)",
    title = "TE class enrichment at ROIs\nH3K36me3 50%"
  ) +
  theme_classic() +
  facet_wrap(~comparison)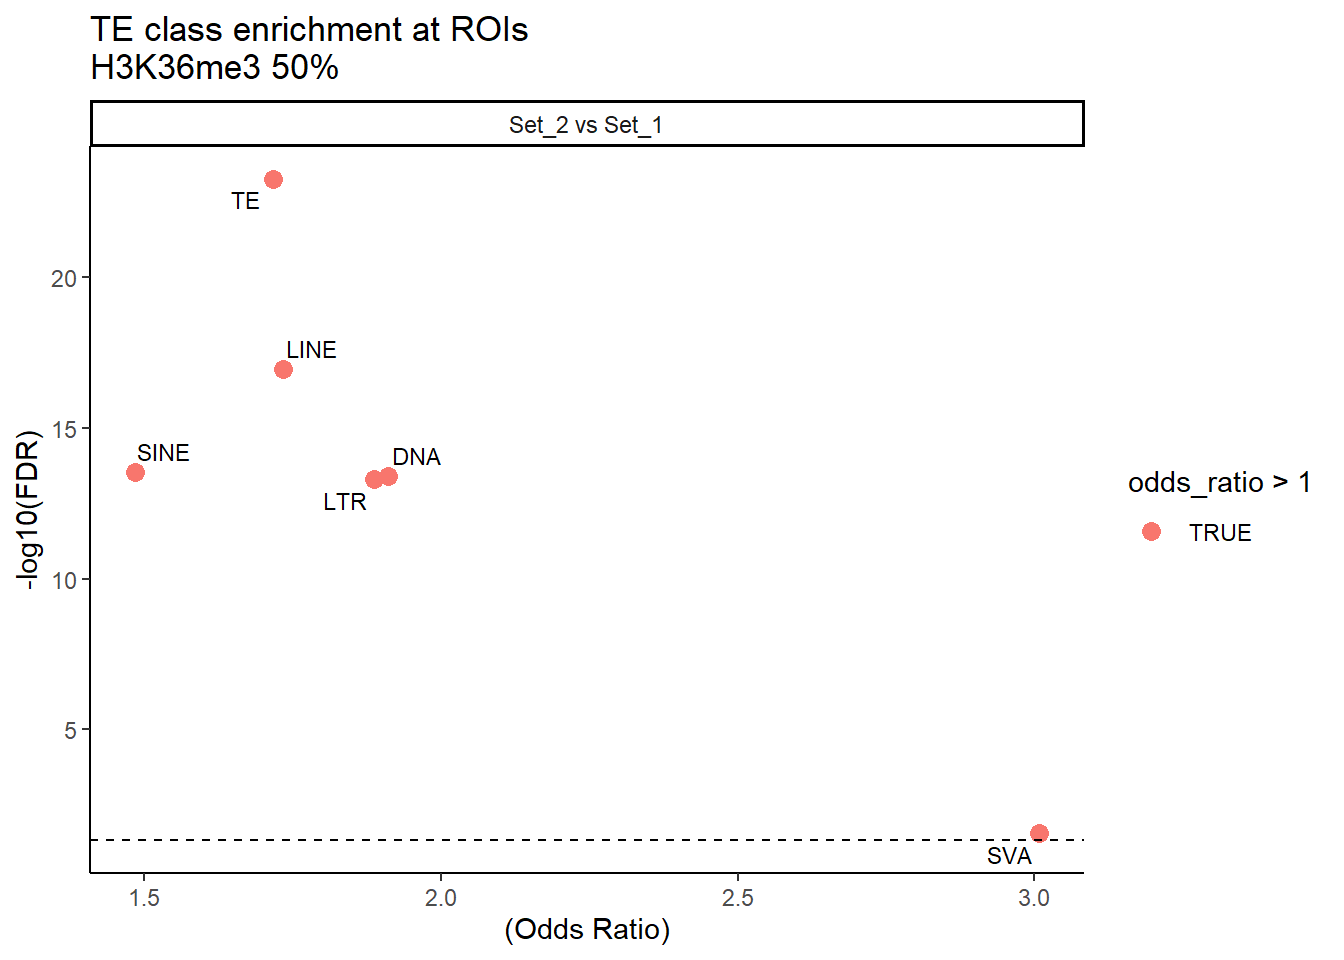
H3K9me3 proportions
results for 1bp overlap H3K9me3
H3K9me3_results_1bp <- map_dfr(TE_types, function(te){
  map_dfr(cluster_pairs_3, function(pair){
    test_pair_TE_generic(H3K9me3_counts_long, te, cluster1 = pair[2], cluster2 = pair[1])
  })
})

htmltools::tagList(
  htmltools::h3("H3K9me3 odds ratio 1bp result"),
datatable(H3K9me3_results_1bp,options = list(
    scrollY = "600px",
    scrollCollapse = TRUE,
    pageLength = 20,
    autoWidth = TRUE
  ),
  rownames = FALSE))
H3K9me3 odds ratio 1bp result
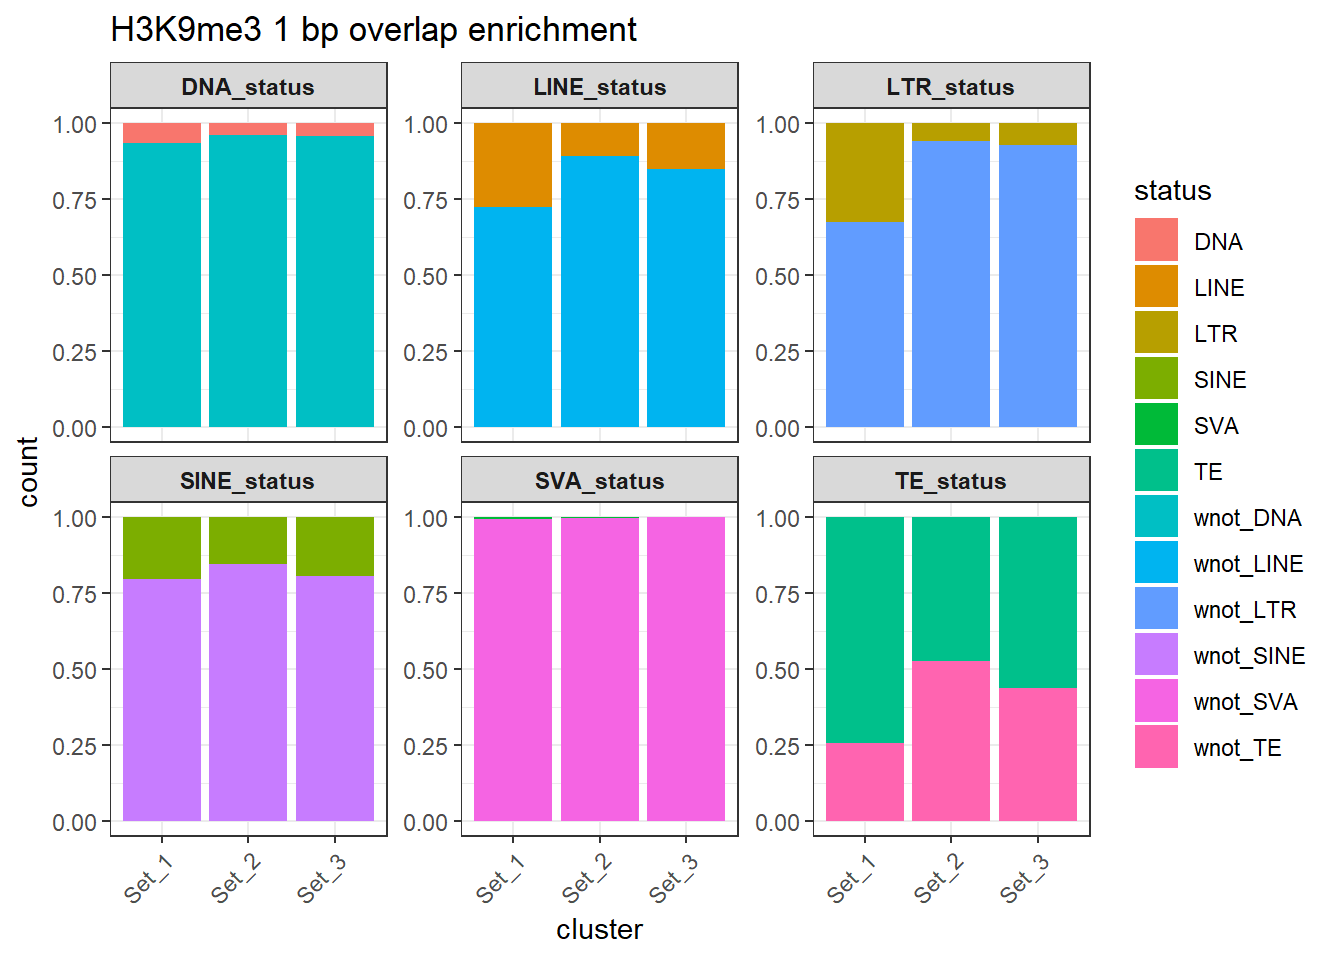
H3K9me3_counts_long %>%
  dplyr::filter(cluster != "not_assigned") %>%
  ggplot(aes(x=cluster, y=count, fill=status)) +
  geom_bar(stat="identity", position = "fill") +
  facet_wrap(~TE_type, scales="free_y")+
  ggtitle("H3K9me3 1 bp overlap enrichment")+
  theme_bw() +
  theme(
    axis.text.x = element_text(angle = 45, hjust = 1),
    strip.text = element_text(face = "bold")
  )
| Version | Author | Date |
|---|---|---|
| 967b7a8 | reneeisnowhere | 2025-09-16 |
H3K9me3_results_1bp %>%
  mutate(TE_label=str_remove(TE_type,"_status$")) %>%
  ggplot(., aes(x = (odds_ratio), y = -log10(p_value),label = TE_label)) +
  geom_point(aes(color = odds_ratio > 1), size = 3) +
   # geom_text_repel(data = subset(SVA_results, FDR < 0.05)) +
  geom_text_repel(size=3, max.overlaps = Inf)+
  geom_hline(yintercept = -log10(0.05), linetype = "dashed") +
  labs(
    x = "(Odds Ratio)",
    y = "-log10(FDR)",
    title = "TE class enrichment at ROIs\nH3K9me3"
  ) +
  theme_classic() +
  facet_wrap(~comparison)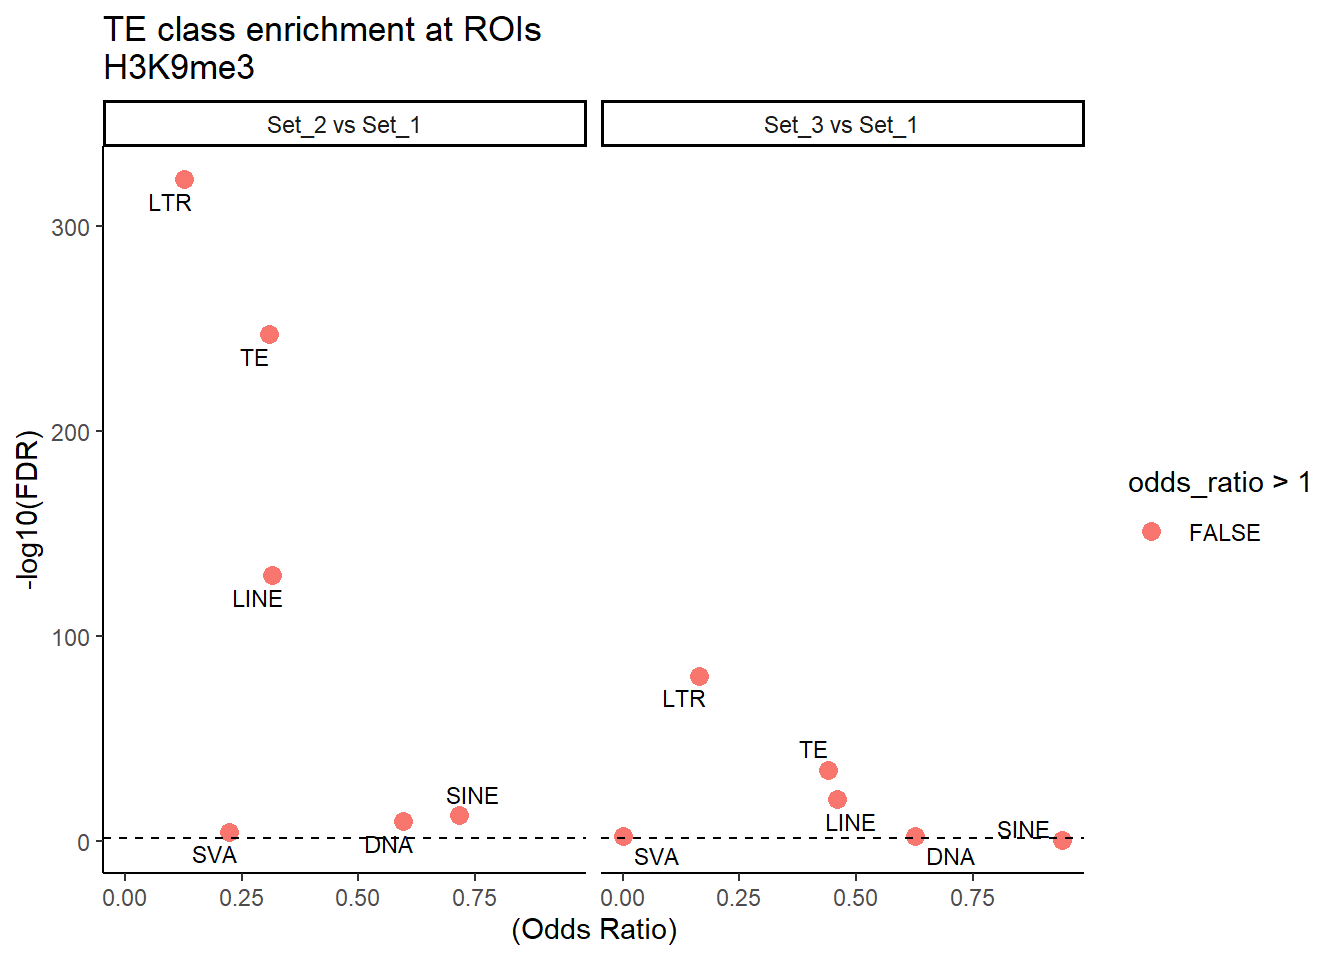
results for 50% TE overlap H3K9me3
###
H3K9me3_results_50per <- map_dfr(TE_types, function(te){
  map_dfr(cluster_pairs_3, function(pair){
    test_pair_TE_generic(H3K9me3_counts_long_50per, te, cluster1 = pair[2], cluster2 = pair[1])
  })
})

htmltools::tagList(
  htmltools::h3("H3K9me3 odds ratio >50% overlap results"),
datatable(H3K9me3_results_50per,options = list(
    scrollY = "600px",
    scrollCollapse = TRUE,
    pageLength = 20,
    autoWidth = TRUE
  ),
  rownames = FALSE))
H3K9me3 odds ratio >50% overlap results
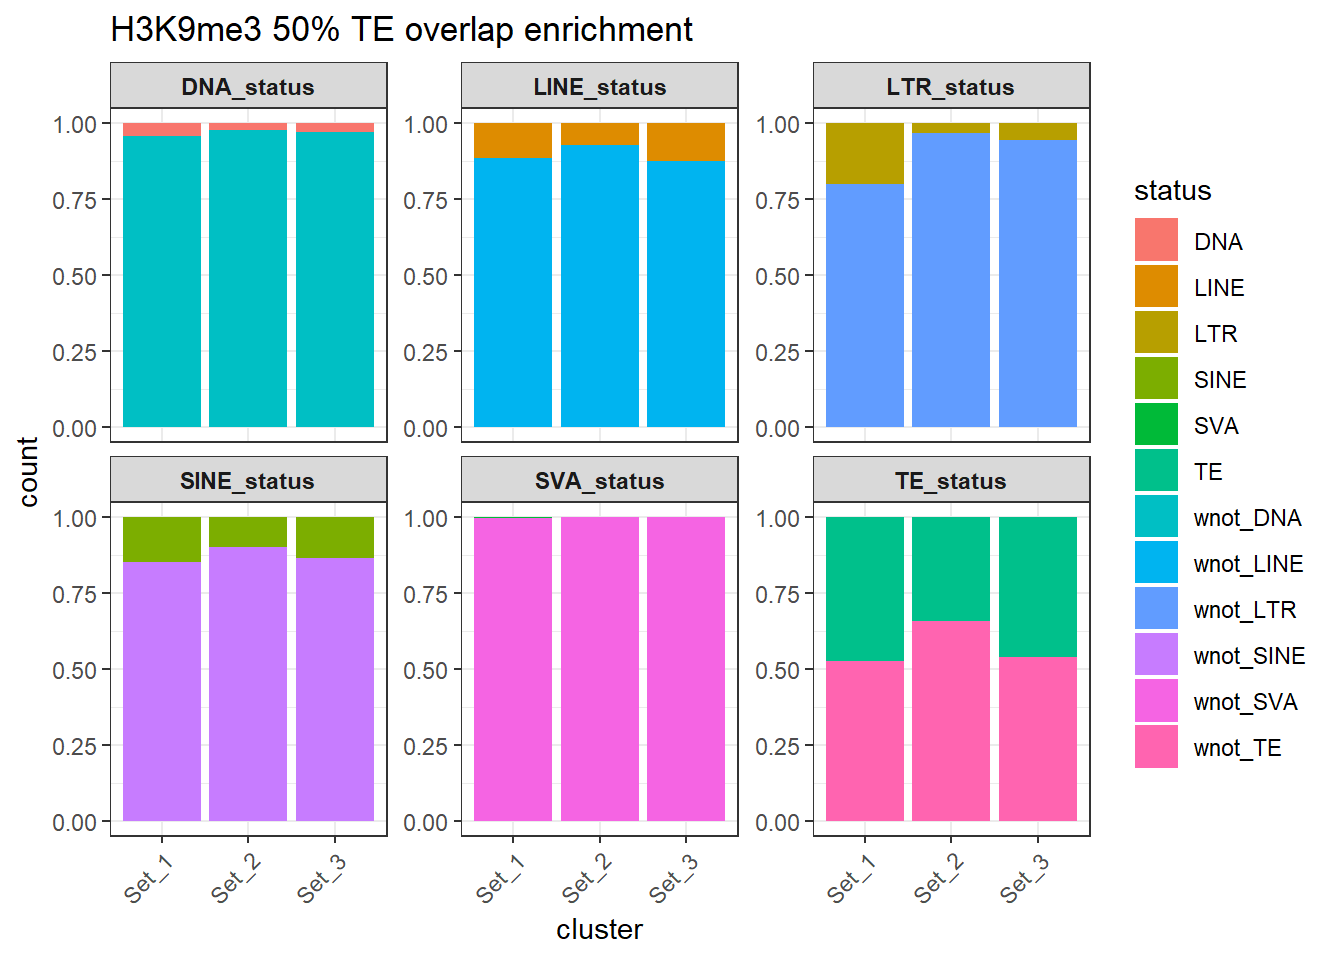
H3K9me3_counts_long_50per %>%
  dplyr::filter(cluster != "not_assigned") %>%
  ggplot(aes(x=cluster, y=count, fill=status)) +
  geom_bar(stat="identity", position = "fill") +
  facet_wrap(~TE_type, scales="free_y")+
  ggtitle("H3K9me3 50% TE overlap enrichment")+
  theme_bw() +
  theme(
    axis.text.x = element_text(angle = 45, hjust = 1),
    strip.text = element_text(face = "bold")
  )
H3K9me3_results_50per %>%
mutate(TE_label=str_remove(TE_type,"_status$")) %>%
ggplot(., aes(x = (odds_ratio), y = -log10(p_value),label = TE_label)) +
geom_point(aes(color = odds_ratio > 1), size = 3) +
# geom_text_repel(data = subset(SVA_results, FDR < 0.05)) +
geom_text_repel(size=3, max.overlaps = Inf)+
geom_hline(yintercept = -log10(0.05), linetype = "dashed") +
labs(
x = "(Odds Ratio)",
y = "-log10(FDR)",
title = "TE class enrichment at ROIs\nH3K9me3 50%"
) +
theme_classic() +
facet_wrap(~comparison)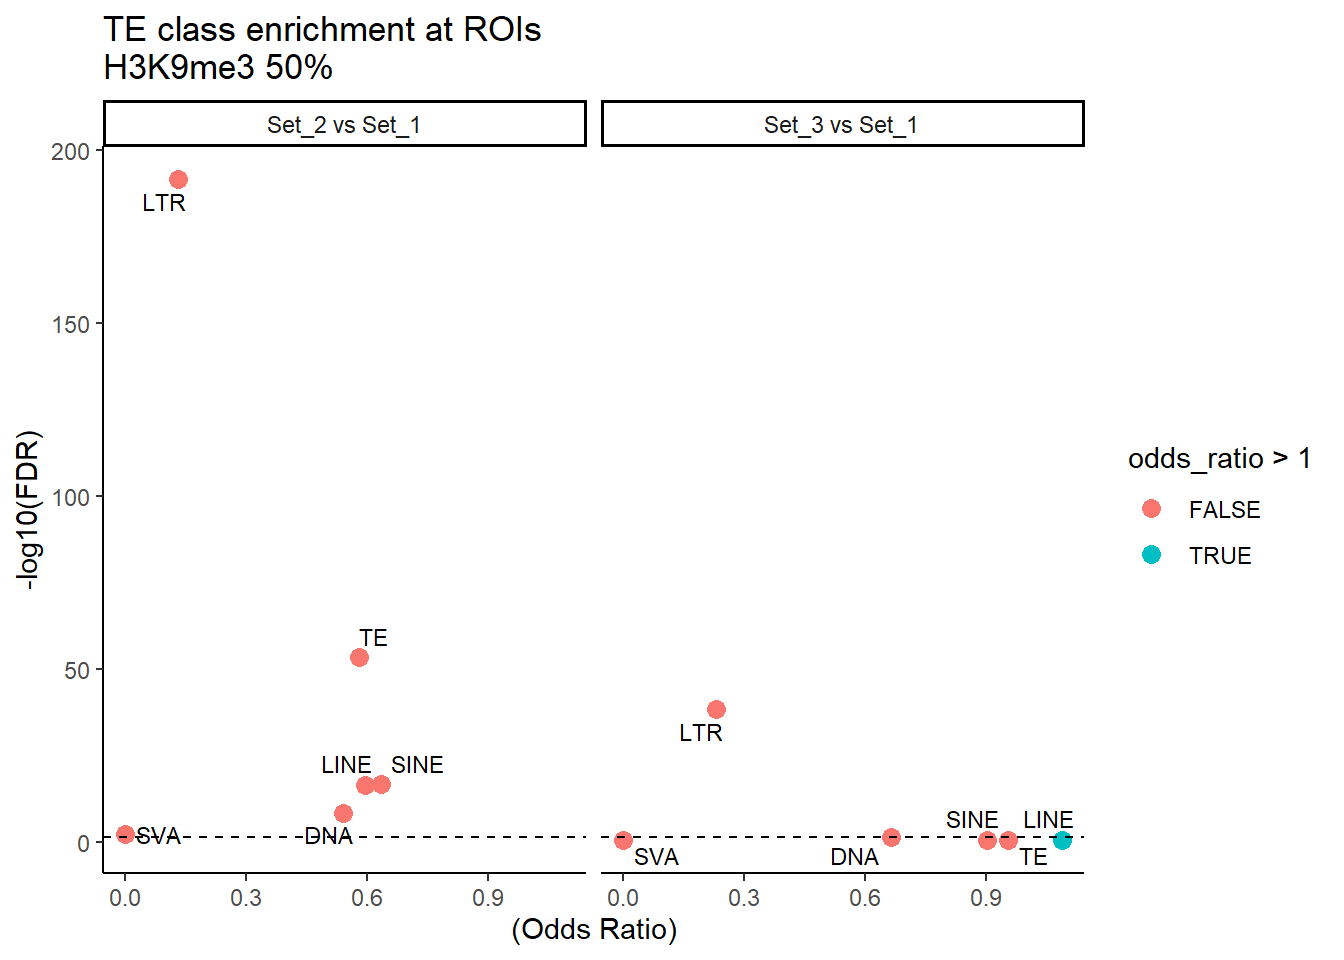 ### Creating non-overlapping TE data sets to be used later
rmskr_nonoverlapping_H3K27ac_gr$te_len <- width(rmskr_nonoverlapping_H3K27ac_gr)

non_ol_H3K27ac_df <- rmskr_nonoverlapping_H3K27ac_gr %>%
  as.data.frame() %>%
  mutate(cluster="non_overlapping", Peakid="non_overlapping", pct_te_overlap=0) %>%
  mutate(special_type=case_when(repClass=="SINE"~"SINE",
                                  repClass=="LINE"~"LINE",
                                  repClass=="LTR"~"LTR",
                                  repClass=="DNA"~"DNA",
                                  repClass=="Retroposon"~"SVA",
                                  is.na(repClass)~"not_TE",
                                  TRUE~"Other")) %>%
     mutate(ppr_div=milliDiv/1e-9) %>%
  dplyr::select(seqnames, start, end, width, strand, Peakid, te_len, pct_te_overlap, repName, repClass, repFamily, milliDiv, milliDel, milliIns, cluster, special_type, ppr_div)
# dplyr::select(seqnames, start, end, width, strand, Peakid, annotation, geneChr, geneStart, geneEnd, geneLength, geneStrand,geneId,transcriptId, distanceToTSS, hit, overlap_bp, roi_len,pct_roi_overlap,te_len, pct_te_overlap, repName, repclass, repFamily, milliDiv, milliDel, milliIns, cluster, special_type, ppr_div)
rmskr_nonoverlapping_H3K27me3_gr$te_len <- width(rmskr_nonoverlapping_H3K27me3_gr)
non_ol_H3K27me3_df <- rmskr_nonoverlapping_H3K27me3_gr %>%
as.data.frame() %>%
mutate(cluster="non_overlapping", Peakid="non_overlapping", pct_te_overlap=0) %>%
mutate(special_type=case_when(repClass=="SINE"~"SINE",
repClass=="LINE"~"LINE",
repClass=="LTR"~"LTR",
repClass=="DNA"~"DNA",
repClass=="Retroposon"~"SVA",
is.na(repClass)~"not_TE",
TRUE~"Other")) %>%
mutate(ppr_div=milliDiv/1e-9) %>%
dplyr::select(seqnames, start, end, width, strand, Peakid, te_len, pct_te_overlap, repName, repClass, repFamily, milliDiv, milliDel, milliIns, cluster, special_type, ppr_div)
# dplyr::select(seqnames, start, end, width, strand, Peakid, annotation, geneChr, geneStart, geneEnd, geneLength, geneStrand,geneId,transcriptId, distanceToTSS, hit, overlap_bp, roi_len,pct_roi_overlap,te_len, pct_te_overlap, repName, repclass, repFamily, milliDiv, milliDel, milliIns, cluster, special_type, ppr_div)rmskr_nonoverlapping_H3K36me3_gr$te_len <- width(rmskr_nonoverlapping_H3K36me3_gr)
non_ol_H3K36me3_df <- rmskr_nonoverlapping_H3K36me3_gr %>%
as.data.frame() %>%
mutate(cluster="non_overlapping", Peakid="non_overlapping", pct_te_overlap=0) %>%
mutate(special_type=case_when(repClass=="SINE"~"SINE",
repClass=="LINE"~"LINE",
repClass=="LTR"~"LTR",
repClass=="DNA"~"DNA",
repClass=="Retroposon"~"SVA",
is.na(repClass)~"not_TE",
TRUE~"Other")) %>%
mutate(ppr_div=milliDiv/1e-9) %>%
dplyr::select(seqnames, start, end, width, strand, Peakid, te_len, pct_te_overlap, repName, repClass, repFamily, milliDiv, milliDel, milliIns, cluster, special_type, ppr_div)
# dplyr::select(seqnames, start, end, width, strand, Peakid, annotation, geneChr, geneStart, geneEnd, geneLength, geneStrand,geneId,transcriptId, distanceToTSS, hit, overlap_bp, roi_len,pct_roi_overlap,te_len, pct_te_overlap, repName, repclass, repFamily, milliDiv, milliDel, milliIns, cluster, special_type, ppr_div)rmskr_nonoverlapping_H3K9me3_gr$te_len <- width(rmskr_nonoverlapping_H3K9me3_gr)
non_ol_H3K9me3_df <- rmskr_nonoverlapping_H3K9me3_gr %>%
as.data.frame() %>%
mutate(cluster="non_overlapping", Peakid="non_overlapping", pct_te_overlap=0) %>%
mutate(special_type=case_when(repClass=="SINE"~"SINE",
repClass=="LINE"~"LINE",
repClass=="LTR"~"LTR",
repClass=="DNA"~"DNA",
repClass=="Retroposon"~"SVA",
is.na(repClass)~"not_TE",
TRUE~"Other")) %>%
mutate(ppr_div=milliDiv/1e-9) %>%
dplyr::select(seqnames, start, end, width, strand, Peakid, te_len, pct_te_overlap, repName, repClass, repFamily, milliDiv, milliDel, milliIns, cluster, special_type, ppr_div)
# dplyr::select(seqnames, start, end, width, strand, Peakid, annotation, geneChr, geneStart, geneEnd, geneLength, geneStrand,geneId,transcriptId, distanceToTSS, hit, overlap_bp, roi_len,pct_roi_overlap,te_len, pct_te_overlap, repName, repclass, repFamily, milliDiv, milliDel, milliIns, cluster, special_type, ppr_div)Creating human genome all TE for comparisons
rmskr_std_gr$te_len <- width(rmskr_std_gr)
human_te_rmskr <- rmskr_std_gr %>%
  as.data.frame() %>%
  mutate(cluster="All_human_te", Peakid="human_tes", pct_te_overlap=0) %>%
  mutate(special_type=case_when(repClass=="SINE"~"SINE",
                                  repClass=="LINE"~"LINE",
                                  repClass=="LTR"~"LTR",
                                  repClass=="DNA"~"DNA",
                                  repClass=="Retroposon"~"SVA",
                                  is.na(repClass)~"not_TE",
                                  TRUE~"Other")) %>%
     mutate(ppr_div=milliDiv/1e-9) %>%
  dplyr::select(seqnames, start, end, width, strand, Peakid, te_len, pct_te_overlap, repName, repClass, repFamily, milliDiv, milliDel, milliIns, cluster, special_type, ppr_div)
H3K27ac divergence from consensus
  H3K27ac_ols$all_H3K27ac %>%
  as.data.frame() %>%
    left_join(., H3K27ac_lookup) %>%
     mutate(cluster = if_else(is.na(cluster), "not_assigned", cluster)) %>%
      dplyr::filter(cluster != "not_assigned") %>%
    mutate(special_type=case_when(str_detect(repClass,"SINE")~"SINE",
                                  str_detect(repClass, "LINE") ~ "LINE",
                                  str_detect(repClass, "LTR") ~ "LTR",
                                  str_detect(repClass, "DNA") ~ "DNA",
                                  str_detect(repClass, "Retroposon") ~ "SVA",
                                  is.na(repClass)~"not_TE",
                                  TRUE~"Other")) %>%
  dplyr::filter(special_type != "not_TE")%>%
    mutate(ppr_div=milliDiv/1e-9) %>%
  dplyr::select(seqnames, start, end, width, strand, Peakid, te_len, pct_te_overlap, repName, repClass, repFamily, milliDiv, milliDel, milliIns, cluster, special_type, ppr_div) %>%
  bind_rows(non_ol_H3K27ac_df) %>%
  bind_rows(human_te_rmskr ) %>%
  ggplot(aes(y=ppr_div,x=cluster))+
  geom_boxplot(aes(fill=cluster) ) +
  facet_wrap(~special_type, scales="free_y") +
    theme_classic()+
    ggtitle("Divergence from overlapping TE H3K27ac 1bp")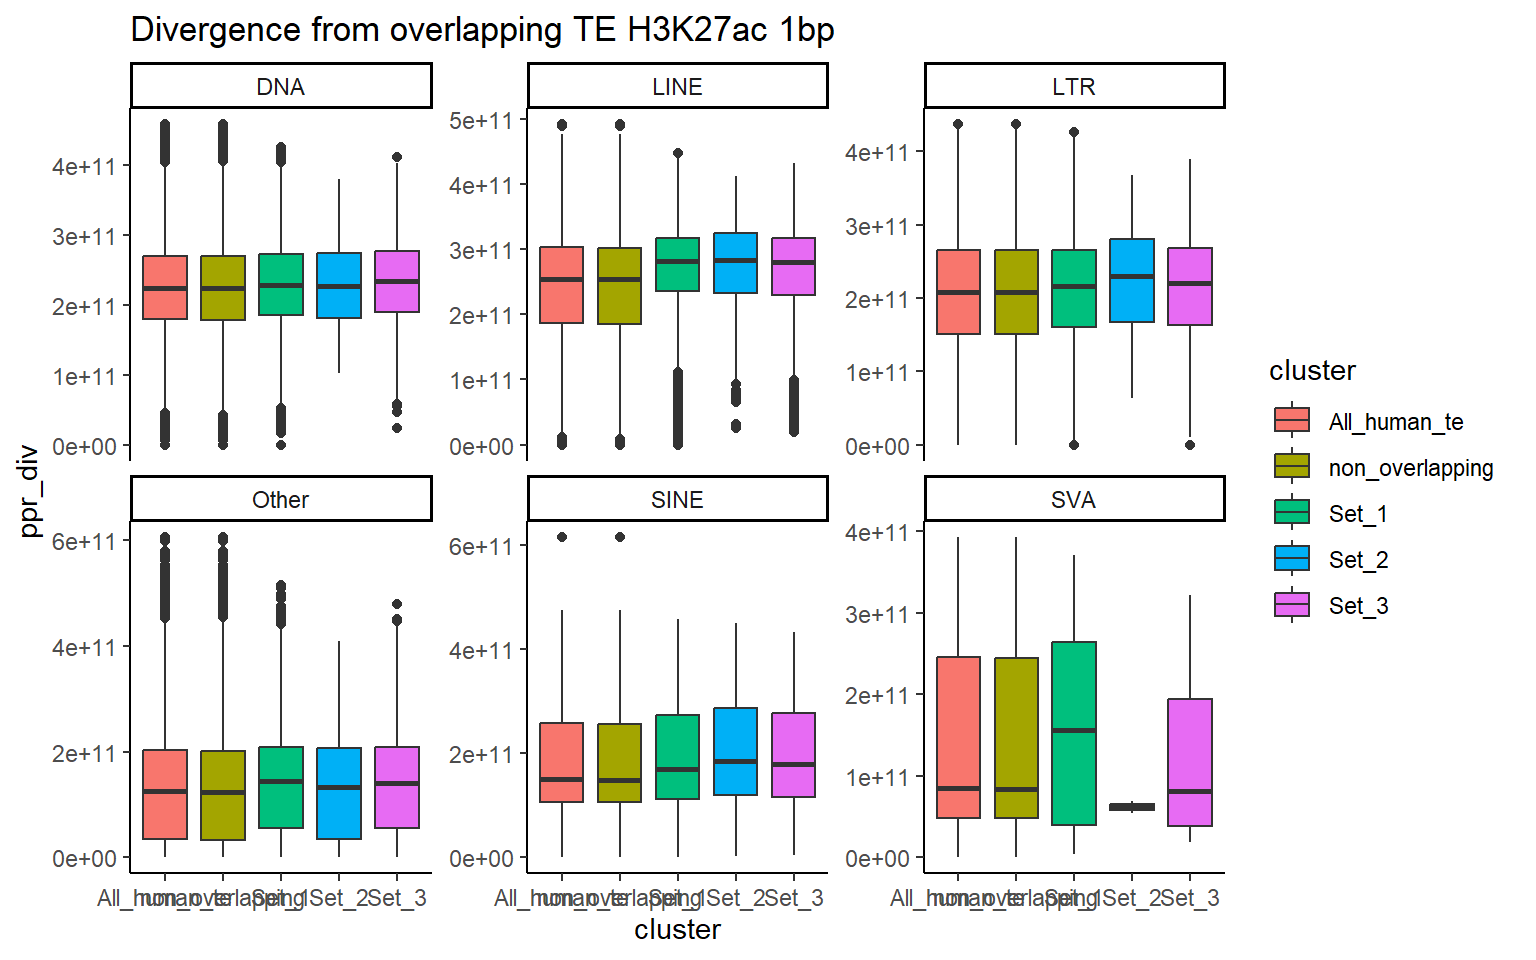
  H3K27ac_ols$all_H3K27ac %>%
  as.data.frame() %>%
    dplyr::filter(pct_te_overlap> 50) %>%
    left_join(., H3K27ac_lookup) %>%
     mutate(cluster = if_else(is.na(cluster), "not_assigned", cluster)) %>%
      dplyr::filter(cluster != "not_assigned") %>%
    mutate(special_type=case_when(str_detect(repClass,"SINE")~"SINE",
                                  str_detect(repClass, "LINE") ~ "LINE",
                                  str_detect(repClass, "LTR") ~ "LTR",
                                  str_detect(repClass, "DNA") ~ "DNA",
                                  str_detect(repClass, "Retroposon") ~ "SVA",
                                  is.na(repClass)~"not_TE",
                                  TRUE~"Other")) %>%
  dplyr::filter(special_type != "not_TE") %>%
    bind_rows(human_te_rmskr ) %>%
     mutate(ppr_div=milliDiv/1e-9) %>%
     ggplot(aes(y=ppr_div,x=cluster))+
  geom_boxplot(aes(fill=cluster) ) +
  facet_wrap(~special_type, scales="free_y") +
# stat_compare_means(
#     aes(group = cluster),               # tell ggpubr we want to compare clusters
#     method = "wilcox.test",             # same test as before
#     comparisons = list(c("Set1", "Set2"), c("Set1", "Set3")),
#     label = "p.signif",                 # show stars instead of p-values
#     hide.ns = TRUE                      # hide non-significant comparisons
#   ) +
    theme_classic()+
    # facet_wrap(~ special_type, scales = "free_y") +
    ggtitle("Divergence from overlapping TE H3K27ac 50% overlap")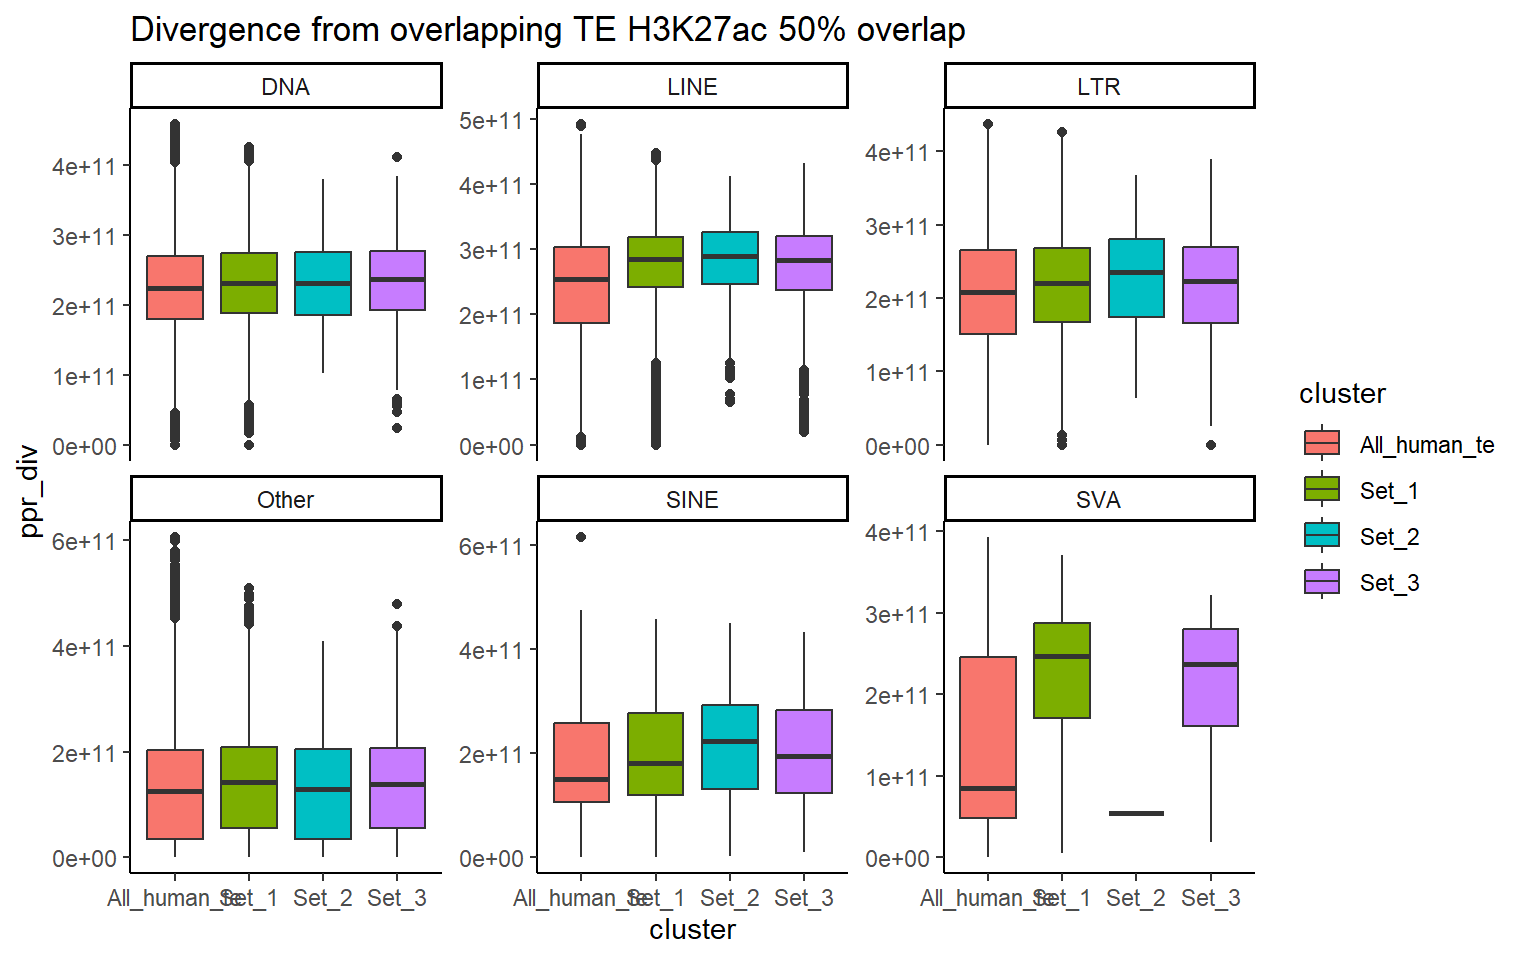
### try to calculate wilcox.test
  comparisons <- list(
  c("Set_1", "Set_2"),
  c("Set_1", "Set_3")
)
  comparisons_2 <- list(
  c("Set_1","Set_2"))

  #
  H3K27ac_wilcox_results <- H3K27ac_ols$all_H3K27ac %>%
    as.data.frame() %>%
    left_join(., H3K27ac_lookup) %>%
     mutate(cluster = if_else(is.na(cluster), "not_assigned", cluster)) %>%
      dplyr::filter(cluster != "not_assigned") %>%
    mutate(special_type=case_when(str_detect(repClass,"SINE")~"SINE",
                                  str_detect(repClass, "LINE") ~ "LINE",
                                  str_detect(repClass, "LTR") ~ "LTR",
                                  str_detect(repClass, "DNA") ~ "DNA",
                                  str_detect(repClass, "Retroposon") ~ "SVA",
                                  is.na(repClass)~"not_TE",
                                  TRUE~"Other")) %>%
  dplyr::filter(special_type != "not_TE") %>%
     mutate(ppr_div=milliDiv/1e-9) %>%
  filter(cluster %in% c("Set_1", "Set_2", "Set_3")) %>%
  group_by(special_type) %>%
  group_map(~ {
    stype <- unique(.x$special_type)  # capture the TE type
    map_dfr(comparisons, function(comp) {
      dat <- .x %>% filter(cluster %in% comp)
      test <- wilcox.test(ppr_div ~ cluster, data = dat)
      tibble(
        special_type = stype,
        comparison = paste(comp, collapse = "_vs_"),
        p.value = test$p.value,
        W = test$statistic,
        median_Set1 = median(dat$ppr_div[dat$cluster == "Set_1"]),
        median_other = median(dat$ppr_div[dat$cluster == comp[2]])
      )
    })
  }, .keep = TRUE) %>%
  bind_rows()

  H3K27ac_wilcox_results_per50 <- H3K27ac_ols$all_H3K27ac %>%
    as.data.frame() %>%
    dplyr::filter(pct_te_overlap> 50) %>%
    left_join(., H3K27ac_lookup) %>%
     mutate(cluster = if_else(is.na(cluster), "not_assigned", cluster)) %>%
      dplyr::filter(cluster != "not_assigned") %>%
    mutate(special_type=case_when(str_detect(repClass,"SINE")~"SINE",
                                  str_detect(repClass, "LINE") ~ "LINE",
                                  str_detect(repClass, "LTR") ~ "LTR",
                                  str_detect(repClass, "DNA") ~ "DNA",
                                  str_detect(repClass, "Retroposon") ~ "SVA",
                                  is.na(repClass)~"not_TE",
                                  TRUE~"Other")) %>%
  dplyr::filter(special_type != "not_TE") %>%
     mutate(ppr_div=milliDiv/1e-9) %>%
  filter(cluster %in% c("Set_1", "Set_2", "Set_3")) %>%
  group_by(special_type) %>%
  group_map(~ {
    stype <- unique(.x$special_type)  # capture the TE type
    map_dfr(comparisons, function(comp) {
      dat <- .x %>% filter(cluster %in% comp)
      test <- wilcox.test(ppr_div ~ cluster, data = dat)
      tibble(
        special_type = stype,
        comparison = paste(comp, collapse = "_vs_"),
        p.value = test$p.value,
        W = test$statistic,
        median_Set1 = median(dat$ppr_div[dat$cluster == "Set_1"]),
        median_other = median(dat$ppr_div[dat$cluster == comp[2]])
      )
    })
  }, .keep = TRUE) %>%
  bind_rows()


  datatable( H3K27ac_wilcox_results,caption = htmltools::tags$caption(
  style = 'caption-side: top; text-align: center; font-weight: bold;',
  "Wilcox test on percent divergence overlapped TEs by 1bp H3K27ac"
))
datatable( H3K27ac_wilcox_results_per50,caption = htmltools::tags$caption(
style = 'caption-side: top; text-align: center; font-weight: bold;',
"Wilcox test on percent divergence of >50% overlapped TEs H3K27ac"
))H3K27me3 divergence from consensus
  # H3K27me3_ols$all_H3K27me3 %>%
  #   left_join(., H3K27me3_lookup) %>%
  #    mutate(cluster = if_else(is.na(cluster), "not_assigned", cluster)) %>%
  #   dplyr::filter(cluster != "not_assigned") %>%
  #   mutate(special_type=case_when(repClass=="SINE"~"SINE",
  #                                 repClass=="LINE"~"LINE",
  #                                 repClass=="LTR"~"LTR",
  #                                 repClass=="DNA"~"DNA",
  #                                 repClass=="Retroposon"~"SVA",
  #                                 is.na(repClass)~"not_TE",
  #                                 TRUE~"Other")) %>%
  #    mutate(ppr_div=milliDiv/1e-9) %>%
  # ggplot(aes(x=ppr_div))+
  # geom_histogram(aes(fill=cluster, alpha = 0.4) ) +
  # facet_wrap(~special_type, scales="free_y") +
  #   theme_classic()


  H3K27me3_ols$all_H3K27me3 %>%
  as.data.frame() %>%
    left_join(., H3K27me3_lookup) %>%
     mutate(cluster = if_else(is.na(cluster), "not_assigned", cluster)) %>%
      dplyr::filter(cluster != "not_assigned") %>%
    mutate(special_type=case_when(str_detect(repClass,"SINE")~"SINE",
                                  str_detect(repClass, "LINE") ~ "LINE",
                                  str_detect(repClass, "LTR") ~ "LTR",
                                  str_detect(repClass, "DNA") ~ "DNA",
                                  str_detect(repClass, "Retroposon") ~ "SVA",
                                  is.na(repClass)~"not_TE",
                                  TRUE~"Other")) %>%
  dplyr::filter(special_type != "not_TE") %>%
     mutate(ppr_div=milliDiv/1e-9) %>%
  dplyr::select(seqnames, start, end, width, strand, Peakid, te_len, pct_te_overlap, repName, repClass, repFamily, milliDiv, milliDel, milliIns, cluster, special_type, ppr_div) %>%
  bind_rows(non_ol_H3K27me3_df) %>%
  bind_rows(human_te_rmskr ) %>%
  ggplot(aes(y=ppr_div,x=cluster))+
  geom_boxplot(aes(fill=cluster) ) +
  facet_wrap(~special_type, scales="free_y") +
    theme_classic()+
    ggtitle("Divergence from overlapping TE H3K27me3 1bp")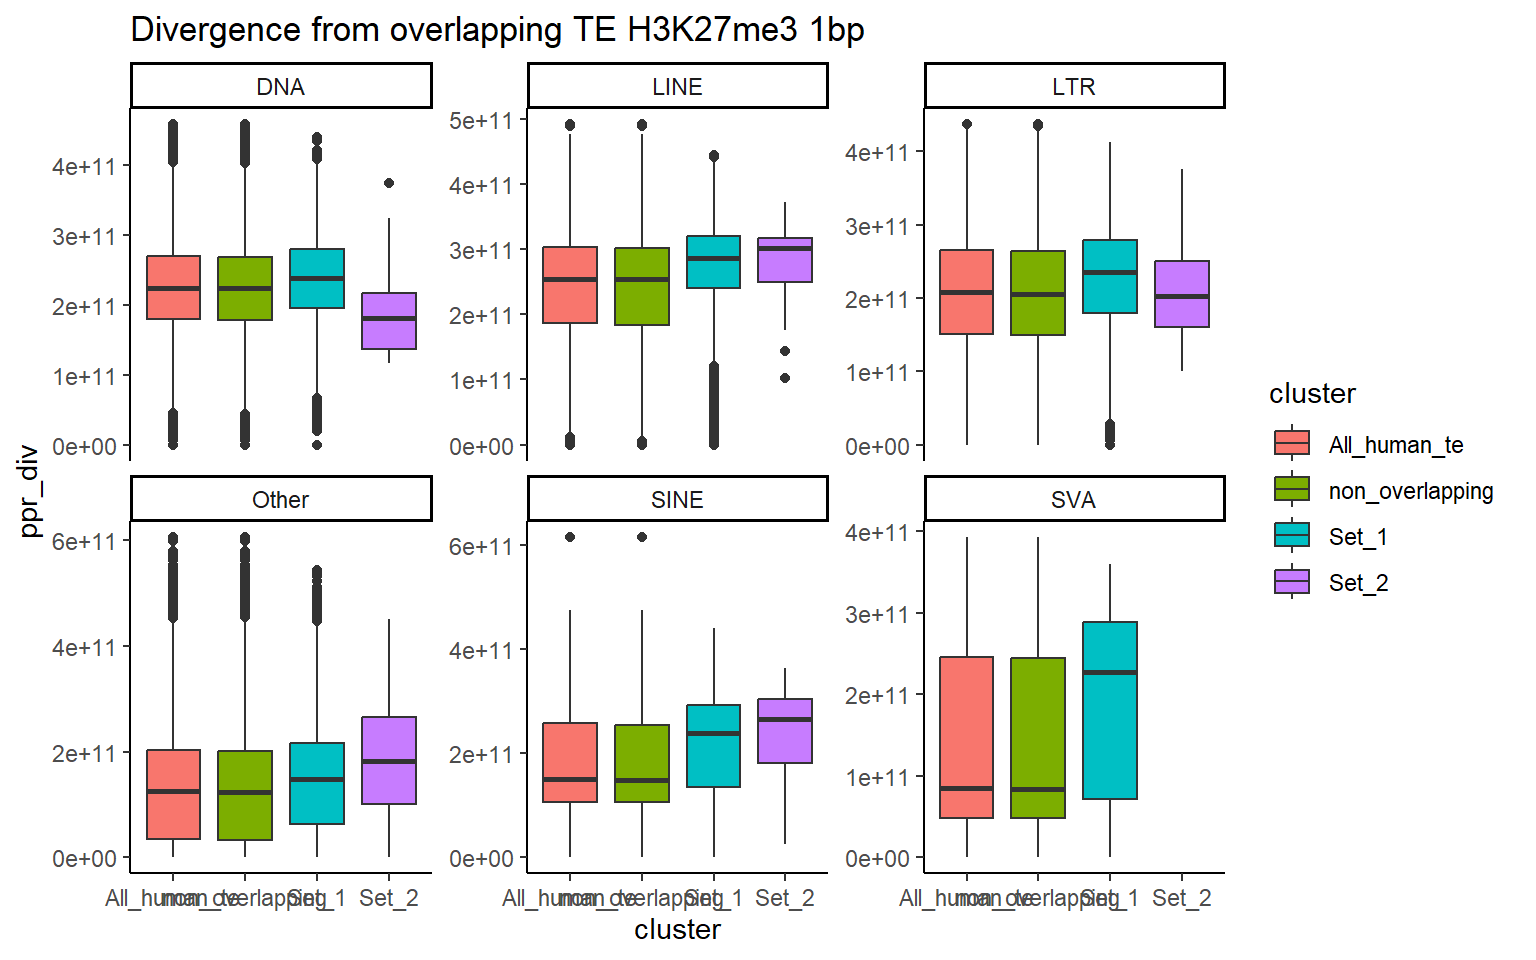
  H3K27me3_ols$all_H3K27me3 %>%
  as.data.frame() %>%
    dplyr::filter(pct_te_overlap> 50) %>%
    left_join(., H3K27me3_lookup) %>%
     mutate(cluster = if_else(is.na(cluster), "not_assigned", cluster)) %>%
      dplyr::filter(cluster != "not_assigned") %>%
    mutate(special_type=case_when(str_detect(repClass,"SINE")~"SINE",
                                  str_detect(repClass, "LINE") ~ "LINE",
                                  str_detect(repClass, "LTR") ~ "LTR",
                                  str_detect(repClass, "DNA") ~ "DNA",
                                  str_detect(repClass, "Retroposon") ~ "SVA",
                                  is.na(repClass)~"not_TE",
                                  TRUE~"Other")) %>%
  dplyr::filter(special_type != "not_TE") %>%
     mutate(ppr_div=milliDiv/1e-9) %>%
    bind_rows(human_te_rmskr ) %>%
      ggplot(aes(y=ppr_div,x=cluster))+
  geom_boxplot(aes(fill=cluster) ) +
  facet_wrap(~special_type, scales="free_y") +
    theme_classic()+
    ggtitle("Divergence from overlapping TE H3K27me3 50% overlap")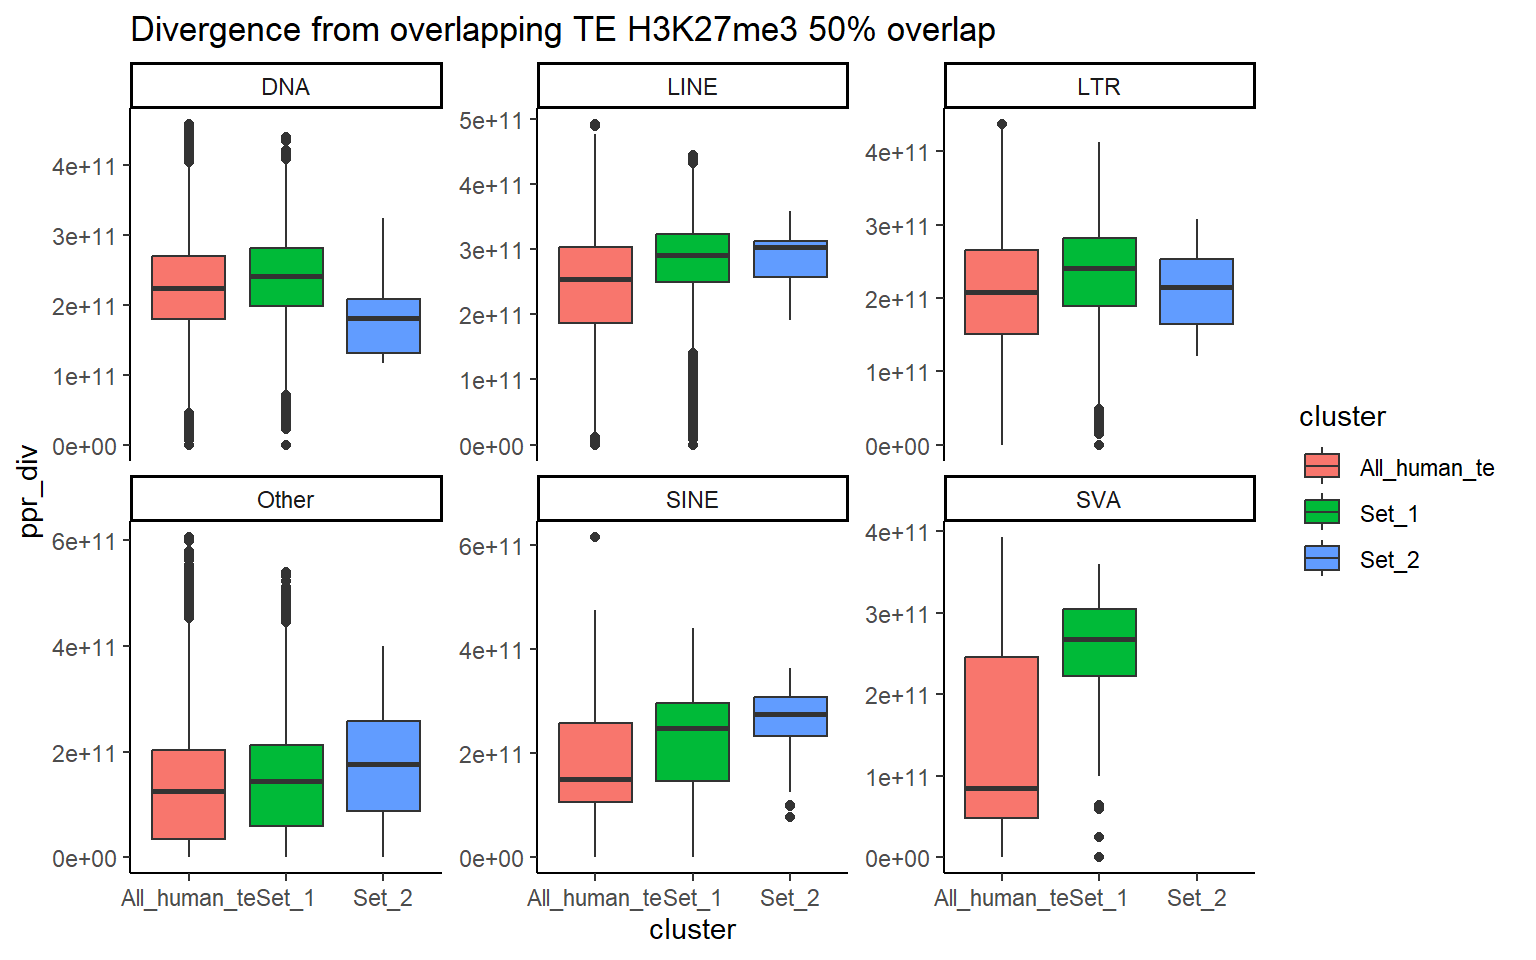
   H3K27me3_wilcox_results <- H3K27me3_ols$all_H3K27me3 %>%
    as.data.frame() %>%
     left_join(., H3K27me3_lookup) %>%
     mutate(cluster = if_else(is.na(cluster), "not_assigned", cluster)) %>%
    dplyr::filter(cluster != "not_assigned") %>%
    mutate(special_type=case_when(str_detect(repClass,"SINE")~"SINE",
                                  str_detect(repClass, "LINE") ~ "LINE",
                                  str_detect(repClass, "LTR") ~ "LTR",
                                  str_detect(repClass, "DNA") ~ "DNA",
                                  str_detect(repClass, "Retroposon") ~ "SVA",
                                  is.na(repClass)~"not_TE",
                                  TRUE~"Other")) %>%
  dplyr::filter(special_type != "not_TE") %>%
     mutate(ppr_div=milliDiv/1e-9) %>%
  filter(cluster %in% c("Set_1", "Set_2")) %>%
  group_by(special_type) %>%
  group_map(~ {
    stype <- unique(.x$special_type)  # capture the TE type
    map_dfr(comparisons_2, function(comp) {
      dat <- .x %>% filter(cluster %in% comp)
       # Skip if both clusters are not present
      if(length(unique(dat$cluster)) < 2) return(NULL)
      test <- wilcox.test(ppr_div ~ cluster, data = dat)
      tibble(
        special_type = stype,
        comparison = paste(comp, collapse = "_vs_"),
        p.value = test$p.value,
        W = test$statistic,
        median_Set1 = median(dat$ppr_div[dat$cluster == "Set_1"]),
        median_other = median(dat$ppr_div[dat$cluster == comp[2]])
      )
    })
  }, .keep = TRUE) %>%
  bind_rows()


 H3K27me3_wilcox_results_per50 <- H3K27me3_ols$all_H3K27me3 %>%
    as.data.frame() %>%
    dplyr::filter(pct_te_overlap> 50) %>%
    left_join(., H3K27me3_lookup) %>%
     mutate(cluster = if_else(is.na(cluster), "not_assigned", cluster)) %>%
    dplyr::filter(cluster != "not_assigned") %>%
    mutate(special_type=case_when(str_detect(repClass,"SINE")~"SINE",
                                  str_detect(repClass, "LINE") ~ "LINE",
                                  str_detect(repClass, "LTR") ~ "LTR",
                                  str_detect(repClass, "DNA") ~ "DNA",
                                  str_detect(repClass, "Retroposon") ~ "SVA",
                                  is.na(repClass)~"not_TE",
                                  TRUE~"Other")) %>%
  dplyr::filter(special_type != "not_TE") %>%
     mutate(ppr_div=milliDiv/1e-9) %>%
  filter(cluster %in% c("Set_1", "Set_2")) %>%
  group_by(special_type) %>%
  group_map(~ {
    stype <- unique(.x$special_type)  # capture the TE type
    map_dfr(comparisons, function(comp) {
      dat <- .x %>% filter(cluster %in% comp)
       # Skip if both clusters are not present
      if(length(unique(dat$cluster)) < 2) return(NULL)
      test <- wilcox.test(ppr_div ~ cluster, data = dat)
      tibble(
        special_type = stype,
        comparison = paste(comp, collapse = "_vs_"),
        p.value = test$p.value,
        W = test$statistic,
        median_Set1 = median(dat$ppr_div[dat$cluster == "Set_1"]),
        median_other = median(dat$ppr_div[dat$cluster == comp[2]])
      )
    })
  }, .keep = TRUE) %>%
  bind_rows()


   datatable( H3K27me3_wilcox_results,caption = htmltools::tags$caption(
  style = 'caption-side: top; text-align: center; font-weight: bold;',
  "Wilcox test on percent divergence overlapped TEs by 1bp H3K27me3"
))
datatable( H3K27me3_wilcox_results_per50,caption = htmltools::tags$caption(
style = 'caption-side: top; text-align: center; font-weight: bold;',
"Wilcox test on percent divergence of >50% overlapped TEs H3K27me3"
))H3K36me3 divergence from consensus
#
#   H3K36me3_ols$all_H3K36me3 %>%
#     left_join(., H3K36me3_lookup) %>%
#      mutate(cluster = if_else(is.na(cluster), "not_assigned", cluster)) %>%
#     dplyr::filter(cluster != "not_assigned") %>%
#     mutate(special_type=case_when(repClass=="SINE"~"SINE",
#                                   repClass=="LINE"~"LINE",
#                                   repClass=="LTR"~"LTR",
#                                   repClass=="DNA"~"DNA",
#                                   repClass=="Retroposon"~"SVA",
#                                   is.na(repClass)~"not_TE",
#                                   TRUE~"Other")) %>%
#      mutate(ppr_div=milliDiv/1e-9) %>%
#   ggplot(aes(x=ppr_div))+
#   geom_histogram(aes(fill=cluster, alpha = 0.4) ) +
#   facet_wrap(~special_type, scales="free_y") +
#     theme_classic()
#


  H3K36me3_ols$all_H3K36me3 %>%
  as.data.frame() %>%
    left_join(., H3K36me3_lookup) %>%
     mutate(cluster = if_else(is.na(cluster), "not_assigned", cluster)) %>%
      dplyr::filter(cluster != "not_assigned") %>%
    mutate(special_type=case_when(str_detect(repClass,"SINE")~"SINE",
                                  str_detect(repClass, "LINE") ~ "LINE",
                                  str_detect(repClass, "LTR") ~ "LTR",
                                  str_detect(repClass, "DNA") ~ "DNA",
                                  str_detect(repClass, "Retroposon") ~ "SVA",
                                  is.na(repClass)~"not_TE",
                                  TRUE~"Other")) %>%
  dplyr::filter(special_type != "not_TE") %>%
     mutate(ppr_div=milliDiv/1e-9) %>%
  dplyr::select(seqnames, start, end, width, strand, Peakid, te_len, pct_te_overlap, repName, repClass, repFamily, milliDiv, milliDel, milliIns, cluster, special_type, ppr_div) %>%
  bind_rows(non_ol_H3K36me3_df) %>%
  bind_rows(human_te_rmskr ) %>%
 ggplot(aes(y=ppr_div,x=cluster))+
  geom_boxplot(aes(fill=cluster) ) +
  facet_wrap(~special_type, scales="free_y") +
    theme_classic()+
    ggtitle("Divergence from overlapping TE H3K36me3 1bp")
  H3K36me3_ols$all_H3K36me3 %>%
  as.data.frame() %>%
    dplyr::filter(pct_te_overlap> 50) %>%
    left_join(., H3K36me3_lookup) %>%
     mutate(cluster = if_else(is.na(cluster), "not_assigned", cluster)) %>%
      dplyr::filter(cluster != "not_assigned") %>%
    mutate(special_type=case_when(str_detect(repClass,"SINE")~"SINE",
                                  str_detect(repClass, "LINE") ~ "LINE",
                                  str_detect(repClass, "LTR") ~ "LTR",
                                  str_detect(repClass, "DNA") ~ "DNA",
                                  str_detect(repClass, "Retroposon") ~ "SVA",
                                  is.na(repClass)~"not_TE",
                                  TRUE~"Other")) %>%
  dplyr::filter(special_type != "not_TE") %>%
     mutate(ppr_div=milliDiv/1e-9) %>%
    bind_rows(human_te_rmskr ) %>%
  ggplot(aes(y=ppr_div,x=cluster))+
  geom_boxplot(aes(fill=cluster) ) +
  facet_wrap(~special_type, scales="free_y") +
    ggtitle("Divergence from overlapping TE H3K36me3 50% overlap")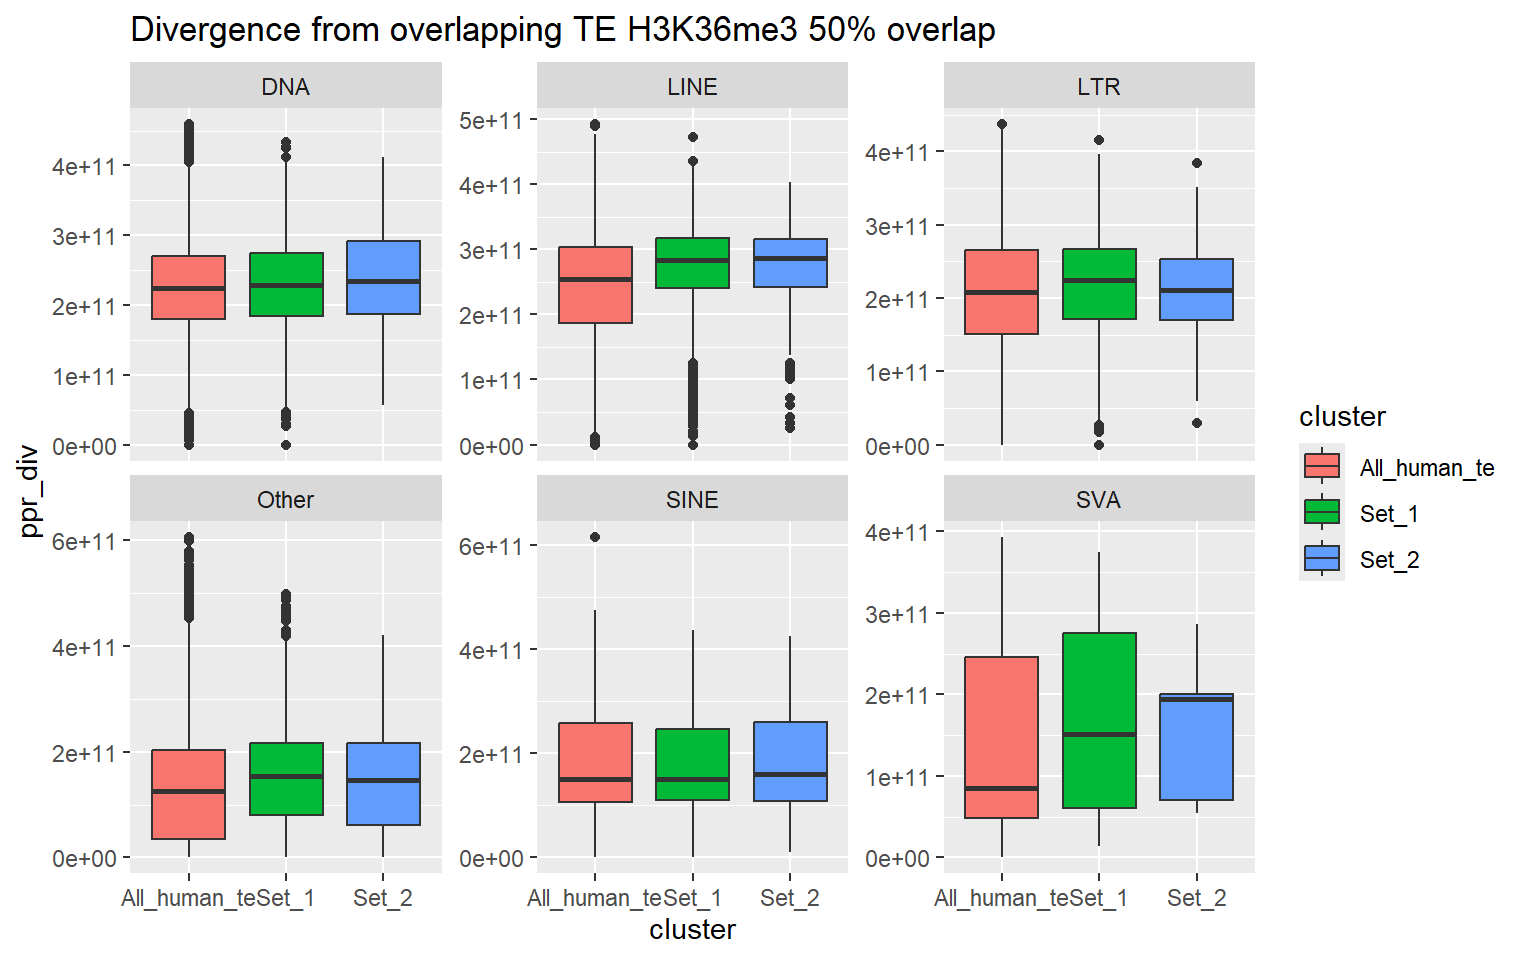
  H3K36me3_ols$all_H3K36me3 %>%
  as.data.frame() %>%
    dplyr::filter(pct_te_overlap> 50) %>%
    left_join(., H3K36me3_lookup) %>%
     mutate(cluster = if_else(is.na(cluster), "not_assigned", cluster)) %>%
      dplyr::filter(cluster != "not_assigned") %>%
    mutate(special_type=case_when(str_detect(repClass,"SINE")~"SINE",
                                  str_detect(repClass, "LINE") ~ "LINE",
                                  str_detect(repClass, "LTR") ~ "LTR",
                                  str_detect(repClass, "DNA") ~ "DNA",
                                  str_detect(repClass, "Retroposon") ~ "SVA",
                                  is.na(repClass)~"not_TE",
                                  TRUE~"Other")) %>%
  dplyr::filter(special_type != "not_TE") %>%
     mutate(ppr_div=milliDiv/1e-9) %>%
  ggplot(aes(y=ppr_div,x=special_type))+
  geom_boxplot(aes(fill=cluster) ) +
  # facet_wrap(~special_type, scales="free_y") +
    theme_classic()+
    ggtitle("Divergence from overlapping TE H3K36me3 50% overlap")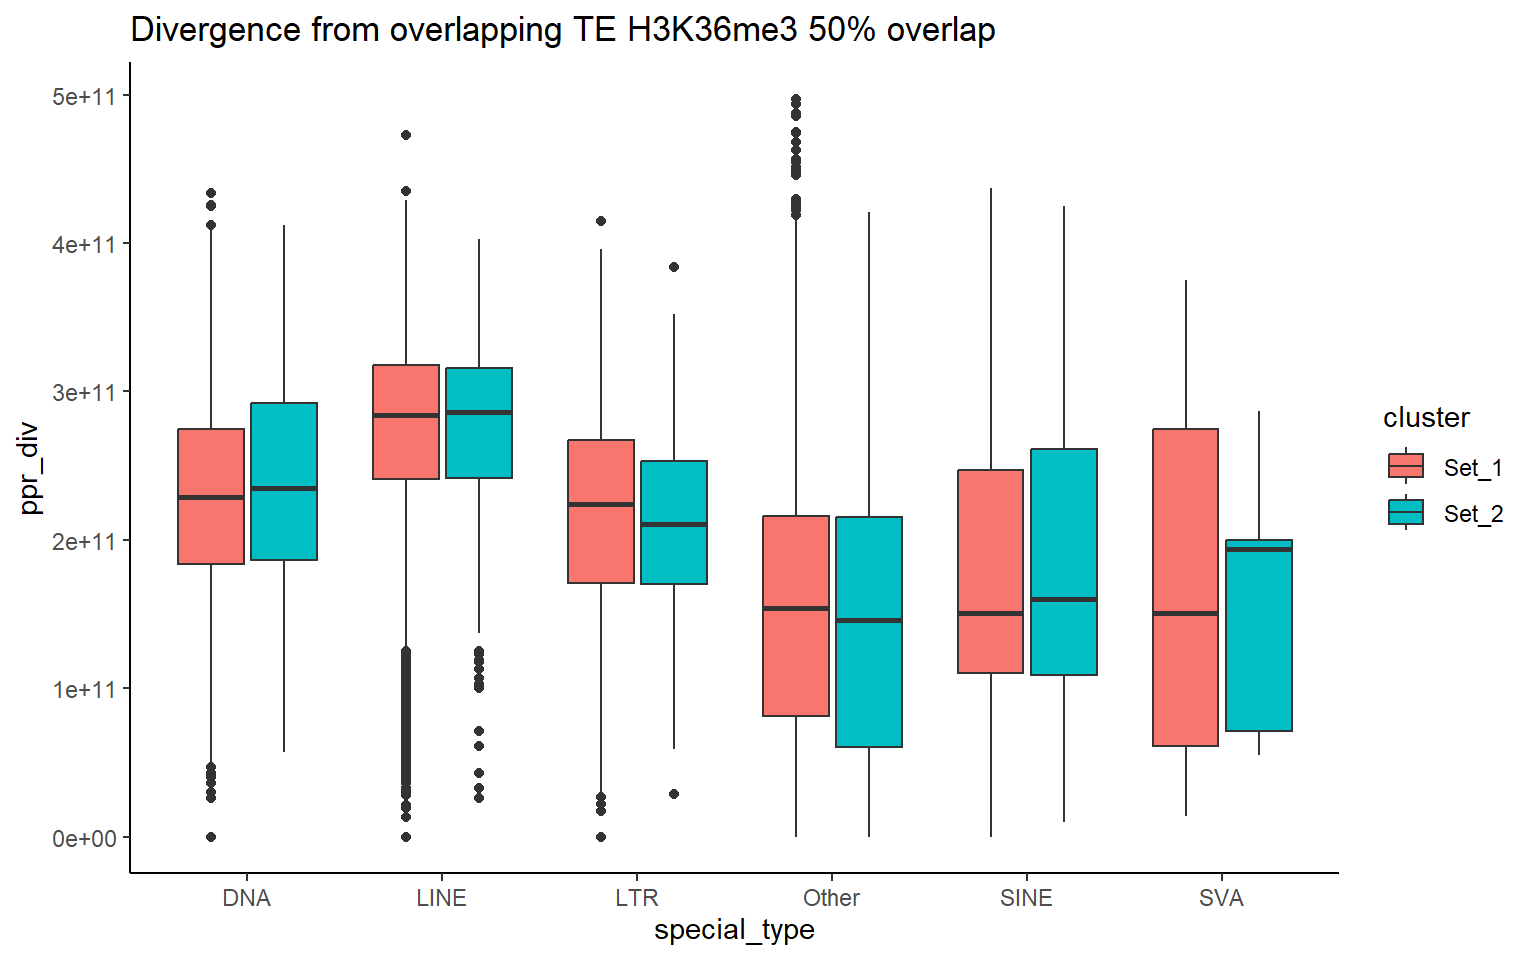
   H3K36me3_wilcox_results <- H3K36me3_ols$all_H3K36me3 %>%
    as.data.frame() %>%
     left_join(., H3K36me3_lookup) %>%
     mutate(cluster = if_else(is.na(cluster), "not_assigned", cluster)) %>%
    dplyr::filter(cluster != "not_assigned") %>%
    mutate(special_type=case_when(str_detect(repClass,"SINE")~"SINE",
                                  str_detect(repClass, "LINE") ~ "LINE",
                                  str_detect(repClass, "LTR") ~ "LTR",
                                  str_detect(repClass, "DNA") ~ "DNA",
                                  str_detect(repClass, "Retroposon") ~ "SVA",
                                  is.na(repClass)~"not_TE",
                                  TRUE~"Other")) %>%
  dplyr::filter(special_type != "not_TE") %>%
     mutate(ppr_div=milliDiv/1e-9) %>%
  filter(cluster %in% c("Set_1", "Set_2")) %>%
  group_by(special_type) %>%
  group_map(~ {
    stype <- unique(.x$special_type)  # capture the TE type
    map_dfr(comparisons_2, function(comp) {
      dat <- .x %>% filter(cluster %in% comp)
       # Skip if both clusters are not present
      if(length(unique(dat$cluster)) < 2) return(NULL)
      test <- wilcox.test(ppr_div ~ cluster, data = dat)
      tibble(
        special_type = stype,
        comparison = paste(comp, collapse = "_vs_"),
        p.value = test$p.value,
        W = test$statistic,
        median_Set1 = median(dat$ppr_div[dat$cluster == "Set_1"]),
        median_other = median(dat$ppr_div[dat$cluster == comp[2]])
      )
    })
  }, .keep = TRUE) %>%
  bind_rows()


   H3K36me3_wilcox_results_per50 <- H3K36me3_ols$all_H3K36me3 %>%
    as.data.frame() %>%
    dplyr::filter(pct_te_overlap> 50) %>%
    left_join(., H3K36me3_lookup) %>%
     mutate(cluster = if_else(is.na(cluster), "not_assigned", cluster)) %>%
    dplyr::filter(cluster != "not_assigned") %>%
    mutate(special_type=case_when(str_detect(repClass,"SINE")~"SINE",
                                  str_detect(repClass, "LINE") ~ "LINE",
                                  str_detect(repClass, "LTR") ~ "LTR",
                                  str_detect(repClass, "DNA") ~ "DNA",
                                  str_detect(repClass, "Retroposon") ~ "SVA",
                                  is.na(repClass)~"not_TE",
                                  TRUE~"Other")) %>%
  dplyr::filter(special_type != "not_TE") %>%
     mutate(ppr_div=milliDiv/1e-9) %>%
  filter(cluster %in% c("Set_1", "Set_2")) %>%
  group_by(special_type) %>%
  group_map(~ {
    stype <- unique(.x$special_type)  # capture the TE type
    map_dfr(comparisons, function(comp) {
      dat <- .x %>% filter(cluster %in% comp)
       # Skip if both clusters are not present
      if(length(unique(dat$cluster)) < 2) return(NULL)
      test <- wilcox.test(ppr_div ~ cluster, data = dat)
      tibble(
        special_type = stype,
        comparison = paste(comp, collapse = "_vs_"),
        p.value = test$p.value,
        W = test$statistic,
        median_Set1 = median(dat$ppr_div[dat$cluster == "Set_1"]),
        median_other = median(dat$ppr_div[dat$cluster == comp[2]])
      )
    })
  }, .keep = TRUE) %>%
  bind_rows()


  datatable( H3K36me3_wilcox_results,caption = htmltools::tags$caption(
  style = 'caption-side: top; text-align: center; font-weight: bold;',
  "Wilcox test on percent divergence overlapped TEs by 1bp H3K36me3"
))
datatable( H3K36me3_wilcox_results_per50,caption = htmltools::tags$caption(
style = 'caption-side: top; text-align: center; font-weight: bold;',
"Wilcox test on percent divergence of >50% overlapped TEs H3K36me3"
))H3K9me3 divergence from consensus
#
#   H3K9me3_ols$all_H3K9me3 %>%
#     left_join(., H3K9me3_lookup) %>%
#      mutate(cluster = if_else(is.na(cluster), "not_assigned", cluster)) %>%
#     mutate(special_type=case_when(repClass=="SINE"~"SINE",
#                                   repClass=="LINE"~"LINE",
#                                   repClass=="LTR"~"LTR",
#                                   repClass=="DNA"~"DNA",
#                                   repClass=="Retroposon"~"SVA",
#                                   is.na(repClass)~"not_TE",
#                                   TRUE~"Other")) %>%
#      mutate(ppr_div=milliDiv/1e-9) %>%
#   ggplot(aes(x=ppr_div))+
#   geom_histogram(aes(fill=cluster, alpha = 0.4) ) +
#   facet_wrap(~special_type, scales="free_y") +
#     theme_classic()


  H3K9me3_ols$all_H3K9me3 %>%
  as.data.frame() %>%
    left_join(., H3K9me3_lookup) %>%
     mutate(cluster = if_else(is.na(cluster), "not_assigned", cluster)) %>%
      dplyr::filter(cluster != "not_assigned") %>%
    mutate(special_type=case_when(str_detect(repClass,"SINE")~"SINE",
                                  str_detect(repClass, "LINE") ~ "LINE",
                                  str_detect(repClass, "LTR") ~ "LTR",
                                  str_detect(repClass, "DNA") ~ "DNA",
                                  str_detect(repClass, "Retroposon") ~ "SVA",
                                  is.na(repClass)~"not_TE",
                                  TRUE~"Other")) %>%
  dplyr::filter(special_type != "not_TE") %>%
     mutate(ppr_div=milliDiv/1e-9) %>%
  dplyr::select(seqnames, start, end, width, strand, Peakid, te_len, pct_te_overlap, repName, repClass, repFamily, milliDiv, milliDel, milliIns, cluster, special_type, ppr_div) %>%
  bind_rows(non_ol_H3K27ac_df) %>%
  bind_rows(human_te_rmskr ) %>%
   ggplot(aes(y=ppr_div,x=cluster))+
  geom_boxplot(aes(fill=cluster) ) +
  facet_wrap(~special_type, scales="free_y") +
    theme_classic()+
    ggtitle("Divergence from overlapping TE H3K9me3 1bp")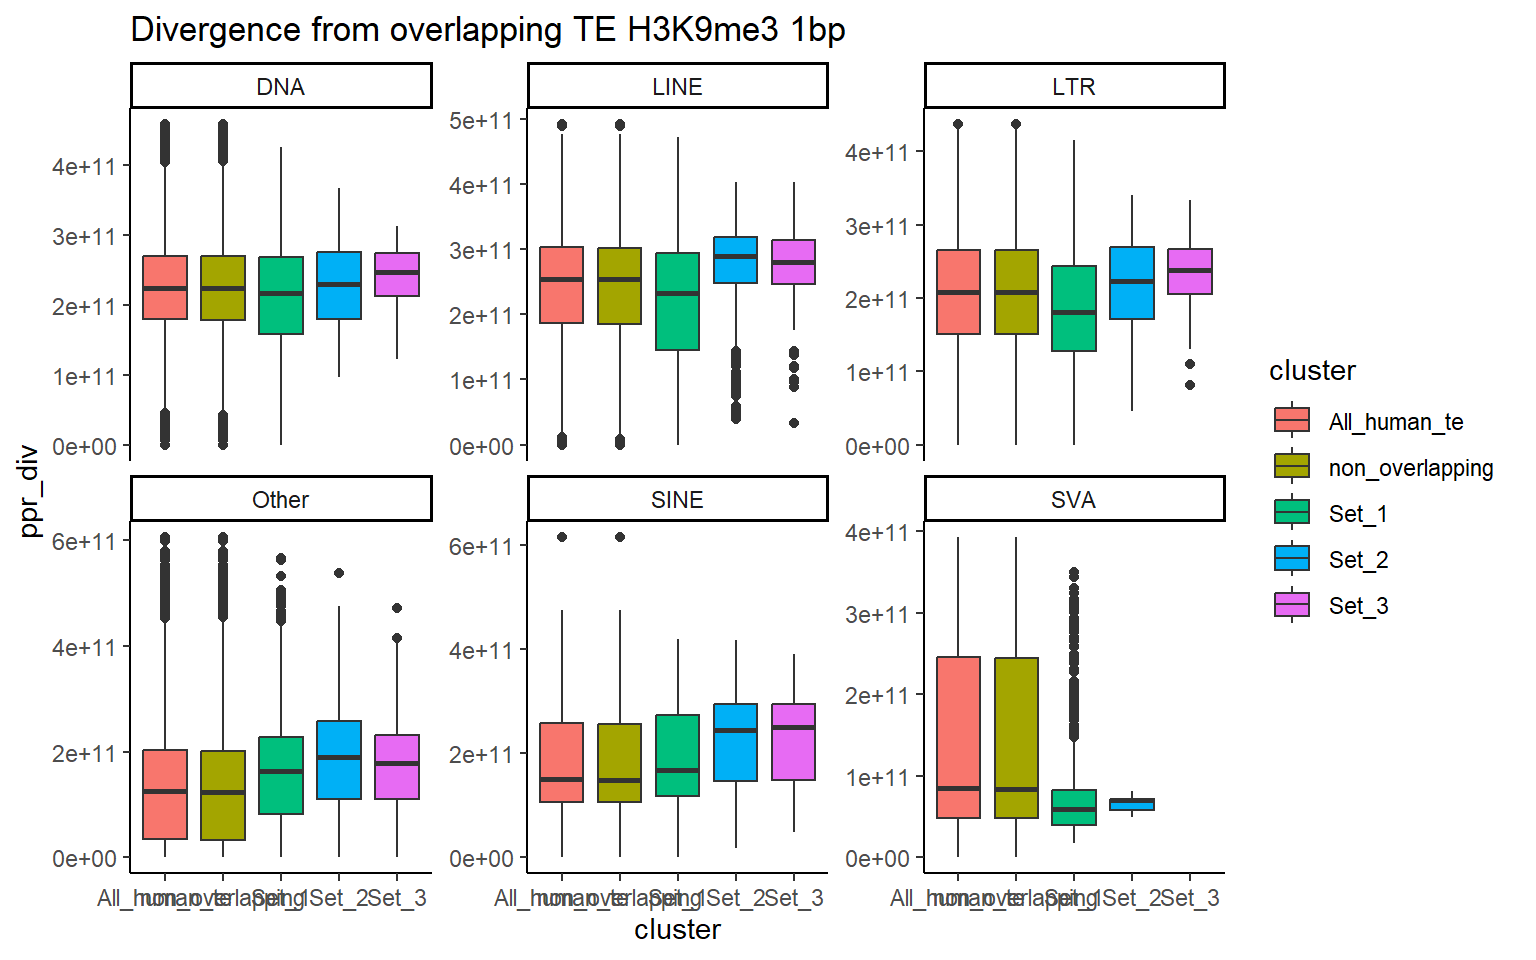
  H3K9me3_ols$all_H3K9me3 %>%
  as.data.frame() %>%
    dplyr::filter(pct_te_overlap> 50) %>%
    left_join(., H3K9me3_lookup) %>%
     mutate(cluster = if_else(is.na(cluster), "not_assigned", cluster)) %>%
      dplyr::filter(cluster != "not_assigned") %>%
    mutate(special_type=case_when(str_detect(repClass,"SINE")~"SINE",
                                  str_detect(repClass, "LINE") ~ "LINE",
                                  str_detect(repClass, "LTR") ~ "LTR",
                                  str_detect(repClass, "DNA") ~ "DNA",
                                  str_detect(repClass, "Retroposon") ~ "SVA",
                                  is.na(repClass)~"not_TE",
                                  TRUE~"Other")) %>%
  dplyr::filter(special_type != "not_TE") %>%
     mutate(ppr_div=milliDiv/1e-9) %>%
    bind_rows(human_te_rmskr ) %>%
   ggplot(aes(y=ppr_div,x=cluster))+
  geom_boxplot(aes(fill=cluster) ) +
  facet_wrap(~special_type, scales="free_y") +
    theme_classic()+
    ggtitle("Divergence from overlapping TE H3K9me3 50% overlap")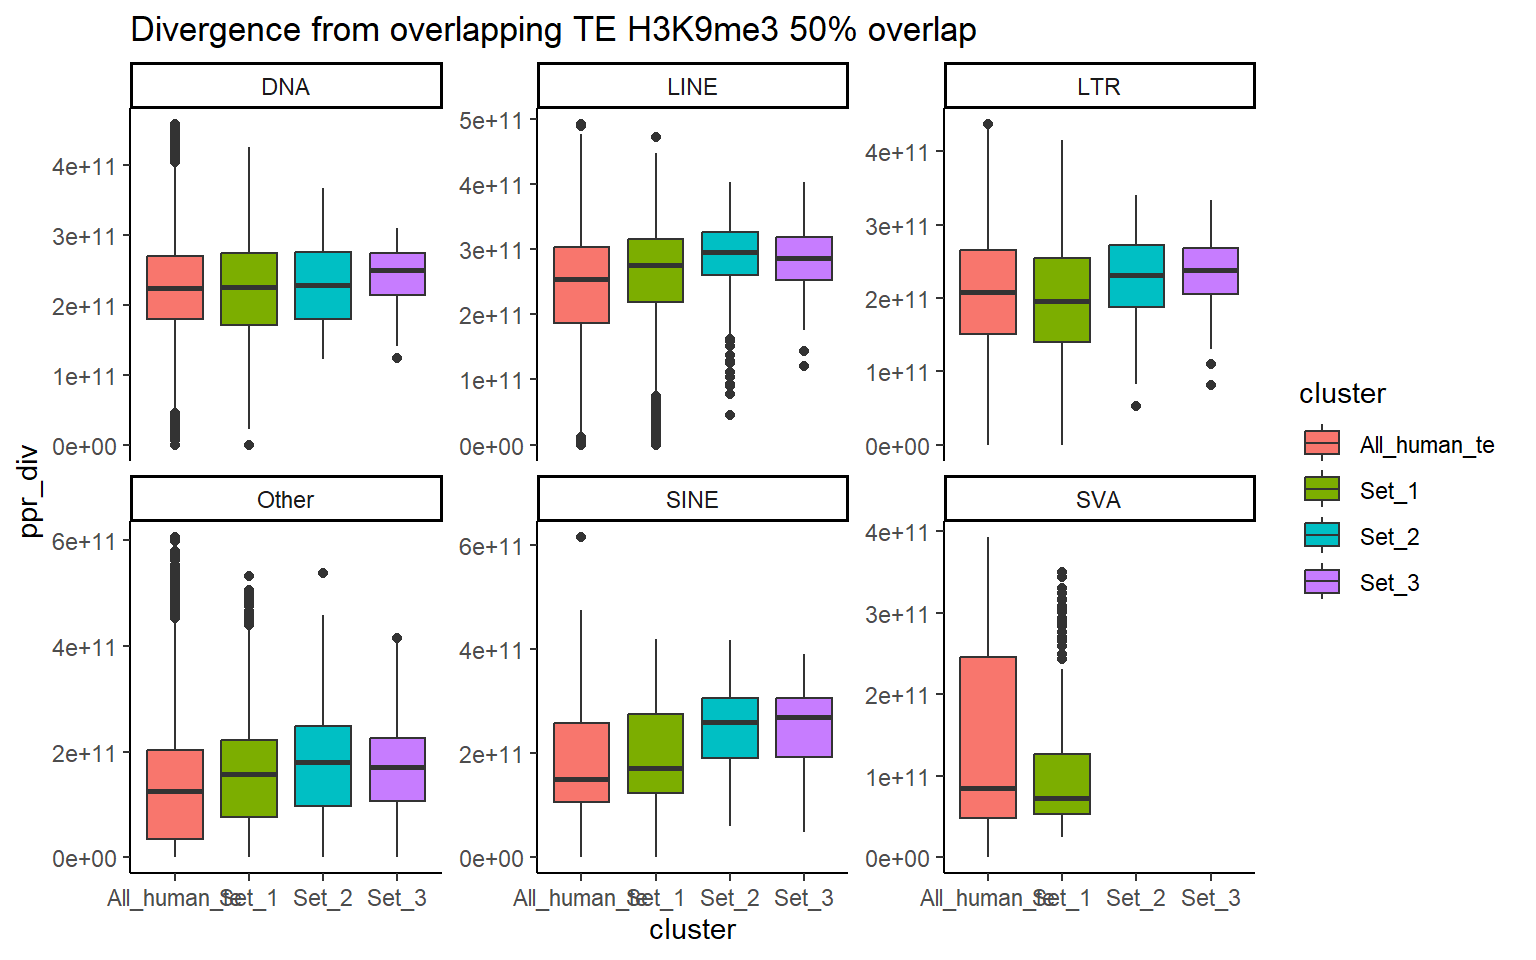
  H3K9me3_wilcox_results <- H3K9me3_ols$all_H3K9me3 %>%
    as.data.frame() %>%
    left_join(., H3K9me3_lookup) %>%
     mutate(cluster = if_else(is.na(cluster), "not_assigned", cluster)) %>%
      dplyr::filter(cluster != "not_assigned") %>%
    mutate(special_type=case_when(str_detect(repClass,"SINE")~"SINE",
                                  str_detect(repClass, "LINE") ~ "LINE",
                                  str_detect(repClass, "LTR") ~ "LTR",
                                  str_detect(repClass, "DNA") ~ "DNA",
                                  str_detect(repClass, "Retroposon") ~ "SVA",
                                  is.na(repClass)~"not_TE",
                                  TRUE~"Other")) %>%
  dplyr::filter(special_type != "not_TE") %>%
     mutate(ppr_div=milliDiv/1e-9) %>%
  filter(cluster %in% c("Set_1", "Set_2", "Set_3")) %>%
  group_by(special_type) %>%
  group_map(~ {
    stype <- unique(.x$special_type)  # capture the TE type
    map_dfr(comparisons, function(comp) {
      dat <- .x %>% filter(cluster %in% comp)
       # Skip if both clusters are not present
      if(length(unique(dat$cluster)) < 2) return(NULL)
      test <- wilcox.test(ppr_div ~ cluster, data = dat)
      tibble(
        special_type = stype,
        comparison = paste(comp, collapse = "_vs_"),
        p.value = test$p.value,
        W = test$statistic,
        median_Set1 = median(dat$ppr_div[dat$cluster == "Set_1"]),
        median_other = median(dat$ppr_div[dat$cluster == comp[2]])
      )
    })
  }, .keep = TRUE) %>%
  bind_rows()

  H3K9me3_wilcox_results_per50 <- H3K9me3_ols$all_H3K9me3 %>%
    as.data.frame() %>%
    dplyr::filter(pct_te_overlap> 50) %>%
    left_join(., H3K9me3_lookup) %>%
     mutate(cluster = if_else(is.na(cluster), "not_assigned", cluster)) %>%
    dplyr::filter(cluster != "not_assigned") %>%
    mutate(special_type=case_when(str_detect(repClass,"SINE")~"SINE",
                                  str_detect(repClass, "LINE") ~ "LINE",
                                  str_detect(repClass, "LTR") ~ "LTR",
                                  str_detect(repClass, "DNA") ~ "DNA",
                                  str_detect(repClass, "Retroposon") ~ "SVA",
                                  is.na(repClass)~"not_TE",
                                  TRUE~"Other")) %>%
  dplyr::filter(special_type != "not_TE") %>%
     mutate(ppr_div=milliDiv/1e-9) %>%
  filter(cluster %in% c("Set_1", "Set_2","Set_3")) %>%
  group_by(special_type) %>%
  group_map(~ {
    stype <- unique(.x$special_type)  # capture the TE type
    map_dfr(comparisons, function(comp) {
      dat <- .x %>% filter(cluster %in% comp)
       # Skip if both clusters are not present
      if(length(unique(dat$cluster)) < 2) return(NULL)
      test <- wilcox.test(ppr_div ~ cluster, data = dat)
      tibble(
        special_type = stype,
        comparison = paste(comp, collapse = "_vs_"),
        p.value = test$p.value,
        W = test$statistic,
        median_Set1 = median(dat$ppr_div[dat$cluster == "Set_1"]),
        median_other = median(dat$ppr_div[dat$cluster == comp[2]])
      )
    })
  }, .keep = TRUE) %>%
  bind_rows()


  datatable( H3K9me3_wilcox_results,caption = htmltools::tags$caption(
  style = 'caption-side: top; text-align: center; font-weight: bold;',
  "Wilcox test on percent divergence overlapped TEs by 1bp H3K9me3"
))
datatable( H3K9me3_wilcox_results_per50,caption = htmltools::tags$caption(
style = 'caption-side: top; text-align: center; font-weight: bold;',
"Wilcox test on percent divergence of >50% overlapped TEs H3K9me3"
))H3K27ac lengths of TE, TSS distance
TE length
ungroup_H3K27ac_repclass <- H3K27ac_ols$all_H3K27ac %>%
   left_join(., H3K27ac_lookup) %>%
     mutate(cluster = if_else(is.na(cluster), "not_assigned", cluster)) %>%
    mutate(special_type=case_when(str_detect("SINE", repClass)~"SINE",
                                  str_detect("LINE", repClass)~"LINE",
                                  str_detect("LTR", repClass)~"LTR",
                                  str_detect("DNA", repClass)~"DNA",
                                  str_detect("Retroposon", repClass)~"SVA",
                                  is.na(repClass)~"not_TE",
                                  TRUE~"Other"))%>%
  dplyr::filter(cluster != "not_assigned")

# H3K27ac_repclass_sum <- ungroup_H3K27ac_repclass %>%
#   group_by(Peakid, special_type) %>%
#   summarize(width= min(width),
#             min_te_len=min(te_len),
#             min_roi_len=min(roi_len),
#             min_overlap=min(overlap_bp),
#             min_dist_TSS=min(distanceToTSS),
#             max_dist_TSS=max(distanceToTSS),
#             cluster=paste0(unique(cluster), collapse = ":"))
#

# H3K27ac_repclass_sum %>%
#   ggplot(aes(x=special_type,y=min_te_len))+
#   geom_boxplot() +
#   facet_wrap(~cluster)+
#   theme_classic()+
#     ggtitle("Overlapping TE minimum length per class in H3K27ac")+
#    coord_cartesian(ylim=c(0,2500))

ungroup_H3K27ac_repclass %>%
  dplyr::select(seqnames, start, end, width, strand, Peakid, te_len, pct_te_overlap, repName, repClass, repFamily, milliDiv, milliDel, milliIns, cluster, special_type) %>%
  bind_rows(non_ol_H3K27ac_df) %>%
  bind_rows(human_te_rmskr ) %>%
  ggplot(aes(x=cluster,y=te_len))+
  geom_boxplot(aes(fill=cluster)) +
  facet_wrap(~special_type)+
  theme_classic()+
    ggtitle("All overlapping TE lengths in H3K27ac")+
   coord_cartesian(ylim=c(0,1700))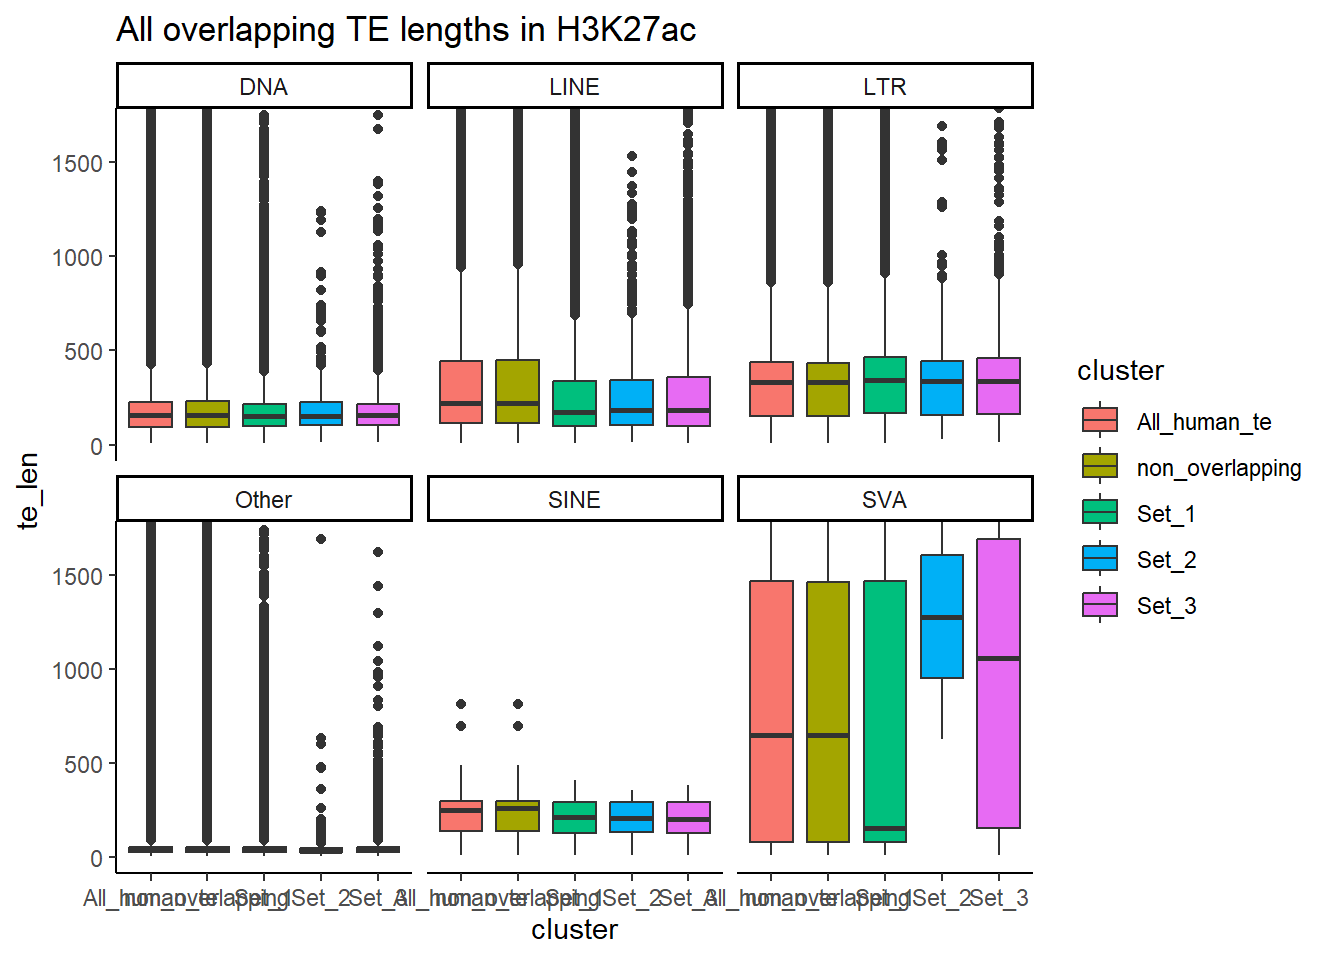
H3K27ac_wilcox_te_len <- ungroup_H3K27ac_repclass %>%
    dplyr::filter(special_type != "not_TE") %>%
    filter(cluster %in% c("Set_1", "Set_2", "Set_3")) %>%
  group_by(special_type) %>%
  group_map(~ {
    stype <- unique(.x$special_type)  # capture the TE type
    map_dfr(comparisons, function(comp) {
      dat <- .x %>% filter(cluster %in% comp)
      test <- wilcox.test(te_len ~ cluster, data = dat)
      tibble(
        special_type = stype,
        comparison = paste(comp, collapse = "_vs_"),
        p.value = test$p.value,
        W = test$statistic,
        median_Set1 = median(dat$te_len[dat$cluster == "Set_1"]),
        median_other = median(dat$te_len[dat$cluster == comp[2]])
      )
    })
  }, .keep = TRUE) %>%
  bind_rows()

 datatable( H3K27ac_wilcox_te_len,caption = htmltools::tags$caption(
  style = 'caption-side: top; text-align: center; font-weight: bold;',
  "Wilcox test on TE length  (>1 bp overlap) H3K27ac"))
Peak length
All_H3K27ac_ROI_df <- H3K27ac_sets_gr$all_H3K27ac %>%
  as.data.frame() %>%
   left_join(., H3K27ac_lookup) %>%
  mutate(cluster = if_else(is.na(cluster), "not_assigned", cluster))


All_H3K27ac_ROI_df %>%
  mutate(cluster="all_regions") %>%
  rbind(.,All_H3K27ac_ROI_df) %>%
  dplyr::filter(cluster != "not_assigned") %>%
  ggplot(aes(x=cluster, y=width))+
  geom_boxplot()+
  ggsignif::geom_signif(comparisons=list(c("all_regions","Set_1"),
                                      c("all_regions","Set_2"),
                                      c("all_regions","Set_3")),
                        y_position = c(2000, 2400, 2800))+
  theme_classic()+
    ggtitle(" All assigned ROI lengths in H3K27ac") +
  coord_cartesian(ylim=c(0,8000))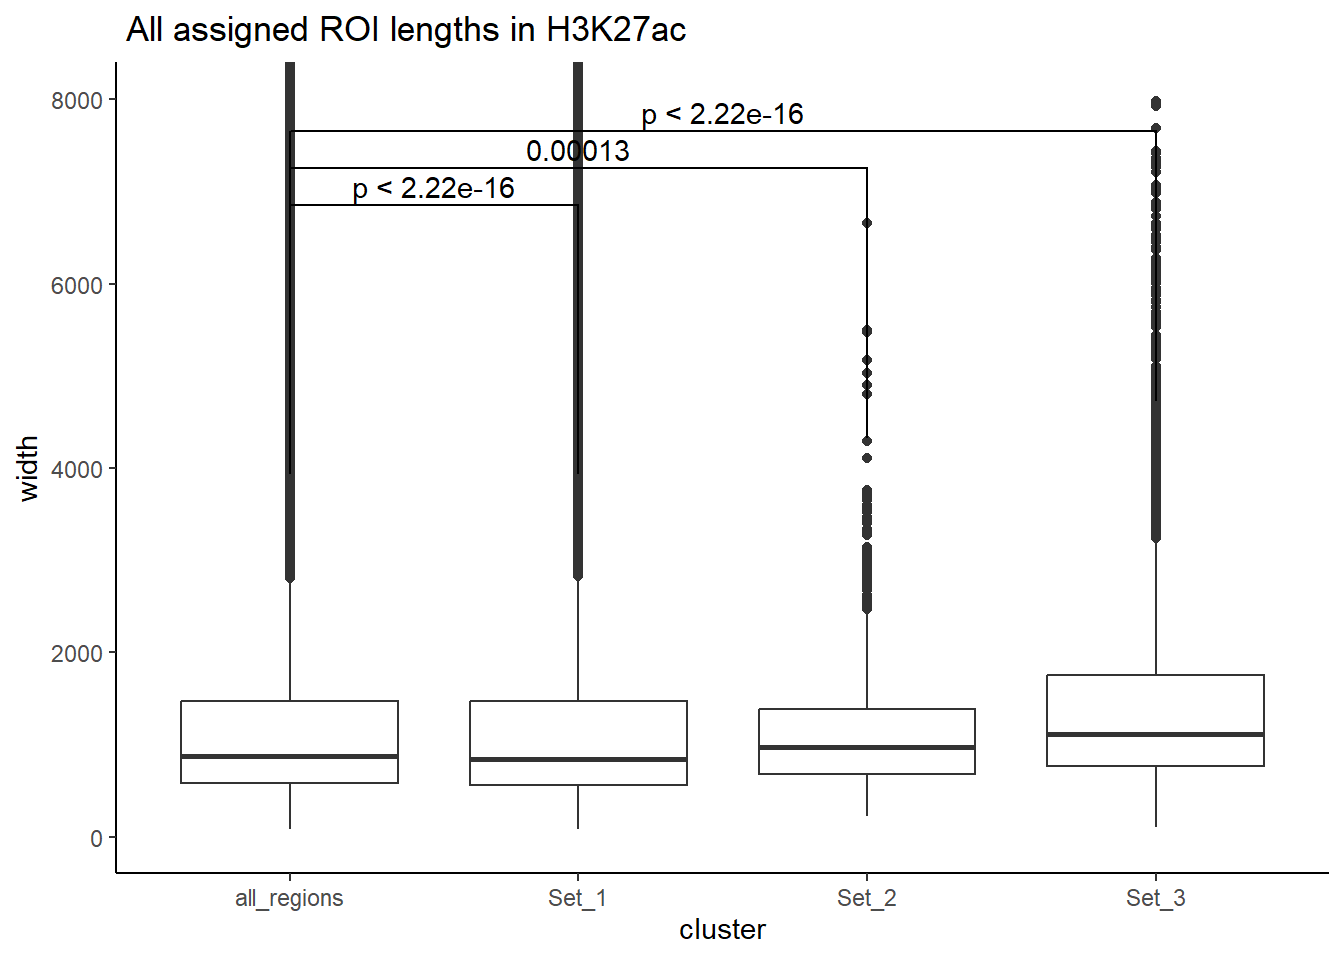
ungroup_H3K27ac_repclass %>%
  ggplot(aes(x=cluster,y=width))+
  geom_boxplot() +
  facet_wrap(~special_type)+
  theme_classic()+
    ggtitle("Width of TE_ROI overlaps in H3K27ac")+
  coord_cartesian(ylim=c(0,1000))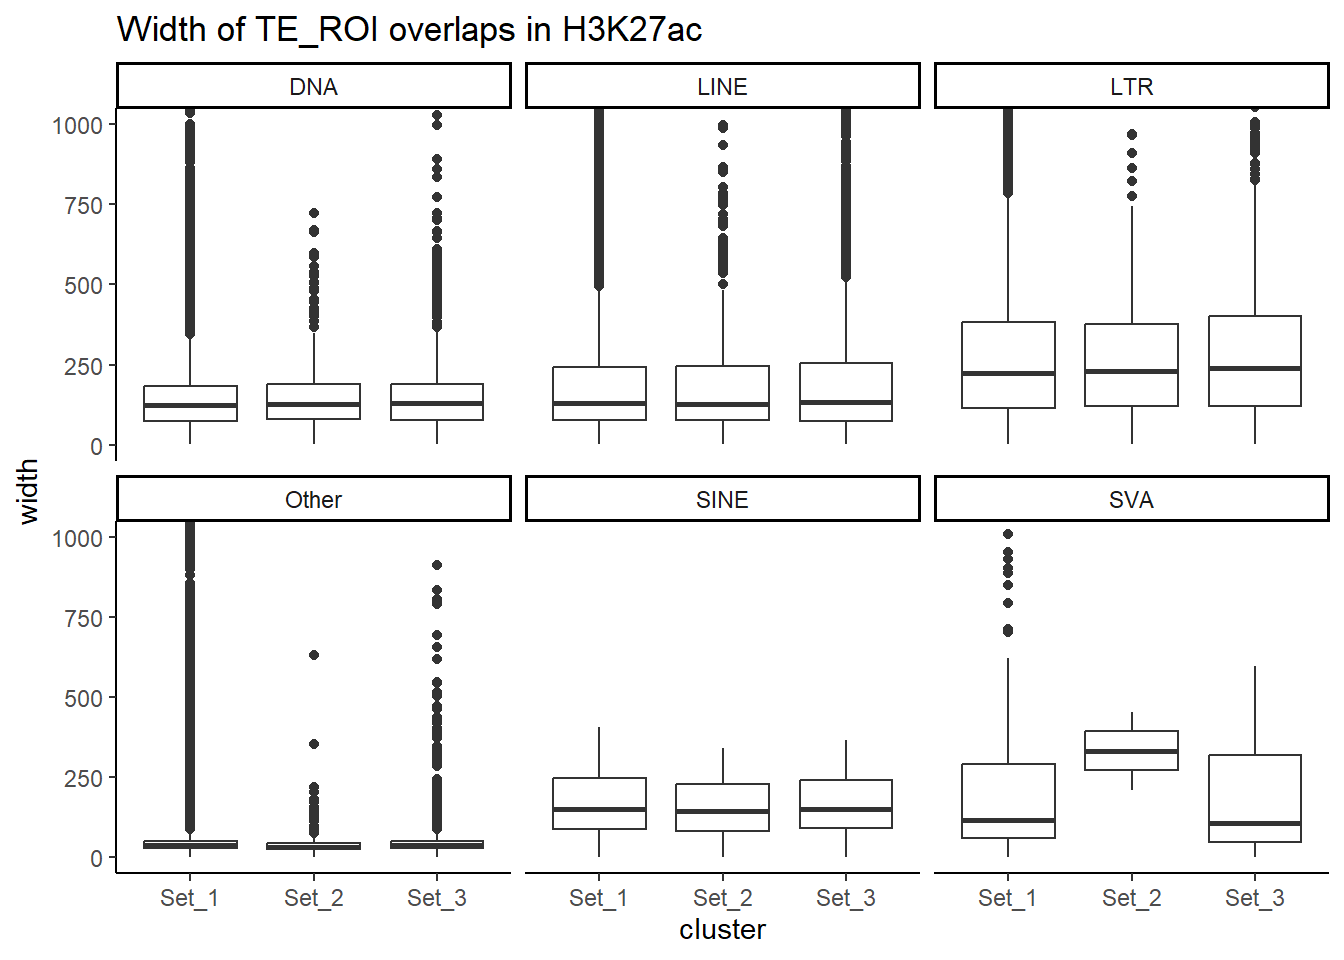
TSS distance
ungroup_H3K27ac_repclass %>%
   group_by(Peakid, special_type) %>%
  summarize(distanceToTSS=min(distanceToTSS),
            cluster=paste0(unique(cluster),collapse = ",")) %>%
  ggplot(aes(x=cluster,y=distanceToTSS))+
  geom_boxplot() +
  facet_wrap(~special_type)+
  theme_classic()+
    ggtitle("Distance to TSS by class in H3K27ac of overlapping ROIs")+
  coord_cartesian(ylim=c(-35000,35000))
| Version | Author | Date |
|---|---|---|
| 1f6e044 | reneeisnowhere | 2025-10-03 |
Percent coverage of TE
ungroup_H3K27ac_repclass %>%
  ggplot(aes(x=cluster,y=pct_te_overlap))+
  geom_boxplot(aes(fill=cluster))+
  facet_wrap(~special_type)+
  theme_classic()+
ggtitle("Percent of TE overlapped in H3K27ac data") 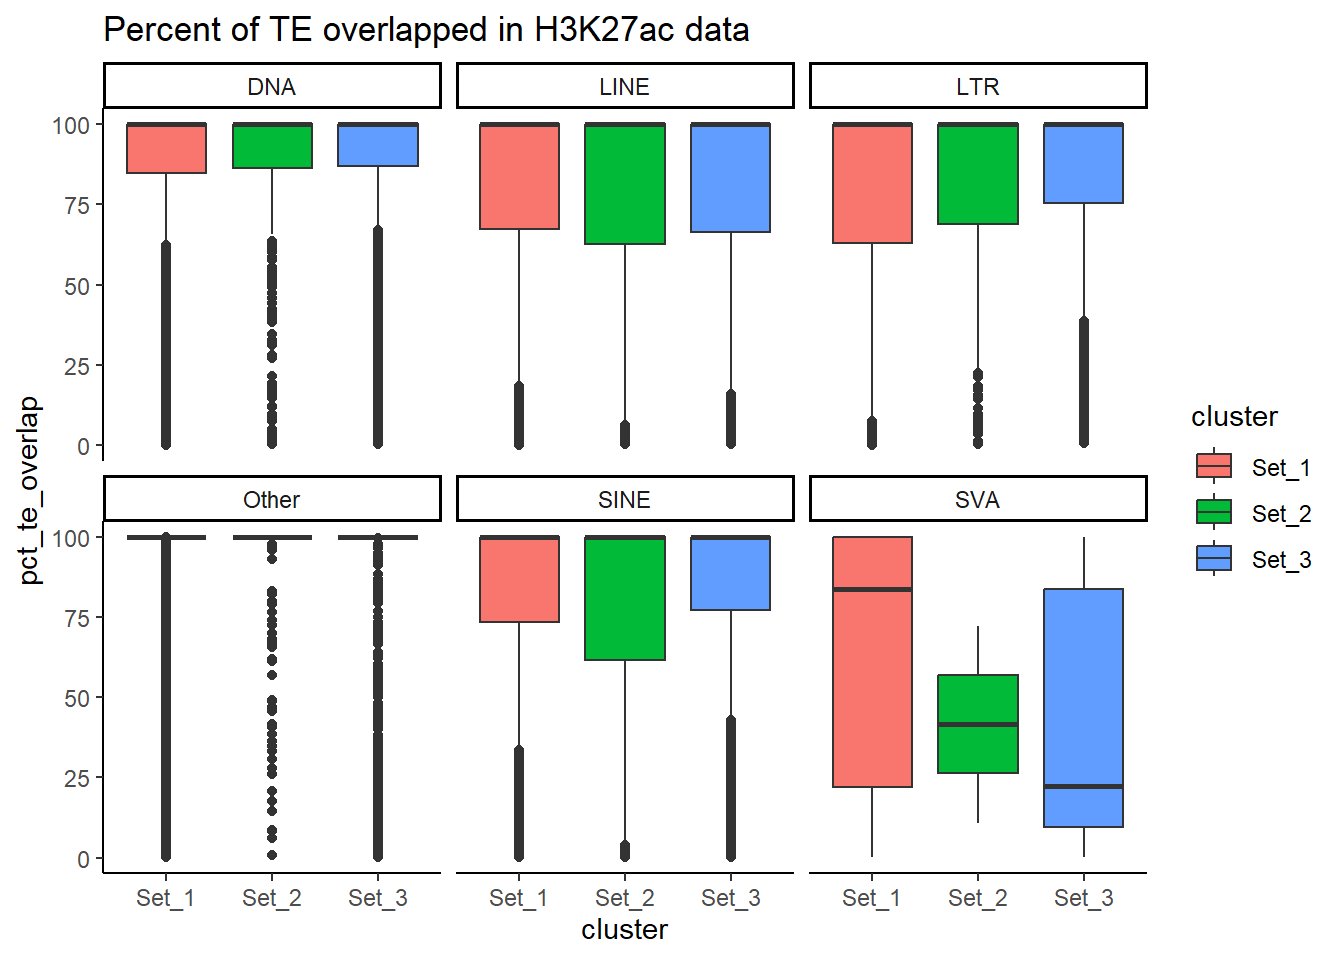
| Version | Author | Date |
|---|---|---|
| 1f6e044 | reneeisnowhere | 2025-10-03 |
comparisons <- list(
  c("Set_1", "Set_2"),
  c("Set_1", "Set_3")
)
Per_TE_cov_H3K27ac <- ungroup_H3K27ac_repclass %>%
 group_by(special_type) %>%
  group_map(~ {
    stype <- unique(.x$special_type)  # capture the TE type
    map_dfr(comparisons, function(comp) {
      dat <- .x %>% filter(cluster %in% comp)
       # Skip if both clusters are not present
      if(length(unique(dat$cluster)) < 2) return(NULL)
      test <- wilcox.test(pct_te_overlap ~ cluster, data = dat)
      tibble(
        special_type = stype,
        comparison = paste(comp, collapse = "_vs_"),
        p.value = test$p.value,
        W = test$statistic,
        median_Set1 = median(dat$pct_te_overlap[dat$cluster == "Set_1"]),
        median_other = median(dat$pct_te_overlap[dat$cluster == comp[2]])
      )
    })
  }, .keep = TRUE) %>%
  bind_rows()


datatable( Per_TE_cov_H3K27ac,caption = htmltools::tags$caption(
  style = 'caption-side: top; text-align: center; font-weight: bold;',
  "Wilcox test of Percent of TE coverage; H3K27ac",

))
H3K27me3 lengths of TE, TSS distance
TE length
ungroup_H3K27me3_repclass <- H3K27me3_ols$all_H3K27me3 %>%
   left_join(., H3K27me3_lookup) %>%
     mutate(cluster = if_else(is.na(cluster), "not_assigned", cluster)) %>%
   mutate(special_type=case_when(str_detect("SINE", repClass)~"SINE",
                                  str_detect("LINE", repClass)~"LINE",
                                  str_detect("LTR", repClass)~"LTR",
                                  str_detect("DNA", repClass)~"DNA",
                                  str_detect("Retroposon", repClass)~"SVA",
                                  is.na(repClass)~"not_TE",
                                  TRUE~"Other"))%>%
  dplyr::filter(cluster != "not_assigned")

# H3K27me3_repclass_sum <- ungroup_H3K27me3_repclass %>%
#   group_by(Peakid, special_type) %>%
#   summarize(width= min(width),
#             min_te_len=min(te_len),
#             min_roi_len=min(roi_len),
#             min_overlap=min(overlap_bp),
#             min_dist_TSS=min(distanceToTSS),
#             max_dist_TSS=max(distanceToTSS),
#             cluster=paste0(unique(cluster), collapse = ":"))
#

# H3K27me3_repclass_sum %>%
#   ggplot(aes(x=special_type,y=min_te_len))+
#   geom_boxplot() +
#   facet_wrap(~cluster)+
#   theme_classic()+
#     ggtitle("Overlapping TE minimum length per class in H3K27me3")+
#    coord_cartesian(ylim=c(0,2500))

ungroup_H3K27me3_repclass %>%
  dplyr::select(seqnames, start, end, width, strand, Peakid, te_len, pct_te_overlap, repName, repClass, repFamily, milliDiv, milliDel, milliIns, cluster, special_type) %>%
  bind_rows(non_ol_H3K27me3_df) %>%
  bind_rows(human_te_rmskr ) %>%
  ggplot(aes(x=cluster,y=te_len))+
  geom_boxplot(aes(fill=cluster)) +
  facet_wrap(~special_type)+
  theme_classic()+
    ggtitle("All overlapping TE lengths in H3K27me3")+
   coord_cartesian(ylim=c(0,1500))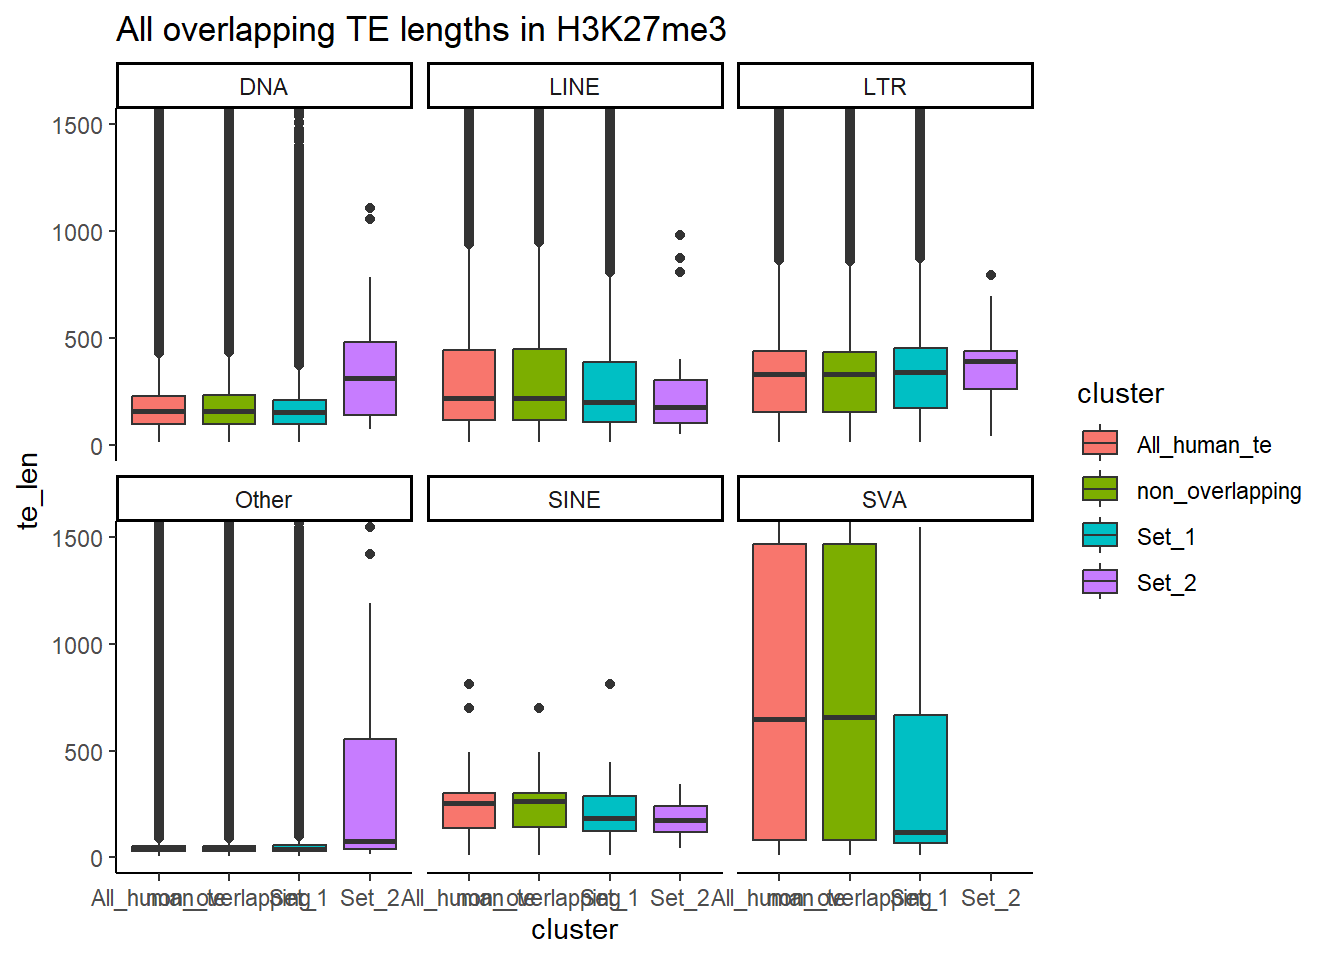
H3K27me3_wilcox_te_len <- ungroup_H3K27me3_repclass %>%
    dplyr::filter(special_type != "not_TE") %>%
    filter(cluster %in% c("Set_1", "Set_2")) %>%
  group_by(special_type) %>%
  group_map(~ {
    stype <- unique(.x$special_type)  # capture the TE type
    map_dfr(comparisons_2, function(comp) {
      dat <- .x %>% filter(cluster %in% comp)

      # only run test if both groups are present
      if (length(unique(dat$cluster)) == 2) {
        test <- wilcox.test(te_len ~ cluster, data = dat)
        tibble(
          special_type = stype,
          comparison   = paste(comp, collapse = "_vs_"),
          p.value      = test$p.value,
          W            = test$statistic,
          median_Set1  = median(dat$te_len[dat$cluster == "Set_1"]),
          median_other = median(dat$te_len[dat$cluster == comp[2]])
        )
      } else {
        tibble(
          special_type = stype,
          comparison   = paste(comp, collapse = "_vs_"),
          p.value      = NA_real_,
          W            = NA_real_,
          median_Set1  = median(dat$te_len[dat$cluster == "Set_1"], na.rm = TRUE),
          median_other = median(dat$te_len[dat$cluster == comp[2]], na.rm = TRUE)
        )
      }
    })
  }, .keep = TRUE) %>%
  bind_rows()

 datatable(H3K27me3_wilcox_te_len,caption = htmltools::tags$caption(
  style = 'caption-side: top; text-align: center; font-weight: bold;',
  "Wilcox test on TE length  (>1 bp overlap) H3K27me3"
))
Peak length
All_H3K27me3_ROI_df <- H3K27me3_sets_gr$all_H3K27me3 %>%
  as.data.frame() %>%
   left_join(., H3K27me3_lookup) %>%
  mutate(cluster = if_else(is.na(cluster), "not_assigned", cluster))


All_H3K27me3_ROI_df %>%
    mutate(cluster="all_regions") %>%
  rbind(.,All_H3K27me3_ROI_df) %>%
  dplyr::filter(cluster != "not_assigned") %>%
  ggplot(aes(x=cluster, y=width))+
  geom_boxplot()+
  ggsignif::geom_signif(comparisons=list(c("all_regions","Set_1"),
                                      c("all_regions","Set_2")
                                     ),
                        y_position = c(2000, 2400, 2800))+
  theme_classic()+
    ggtitle(" All assigned ROI lengths in H3K27me3") +
  coord_cartesian(ylim=c(0,6000))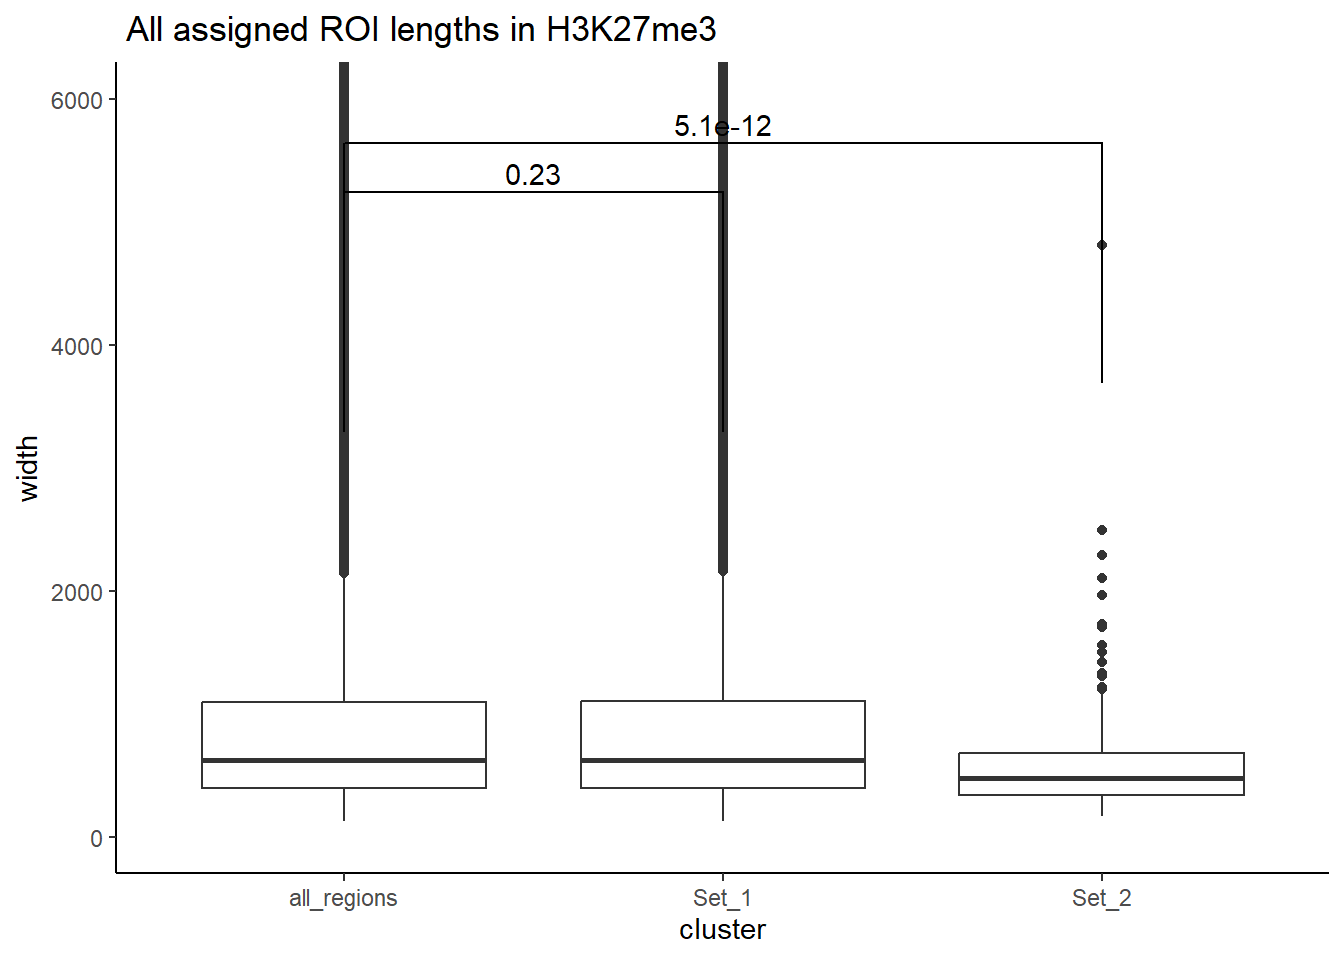
ungroup_H3K27me3_repclass %>%
  ggplot(aes(x=special_type,y=width))+
  geom_boxplot() +
  facet_wrap(~cluster)+
  theme_classic()+
    ggtitle("Width of TE_ROI overlaps in H3K27me3")+
  coord_cartesian(ylim=c(0,2000))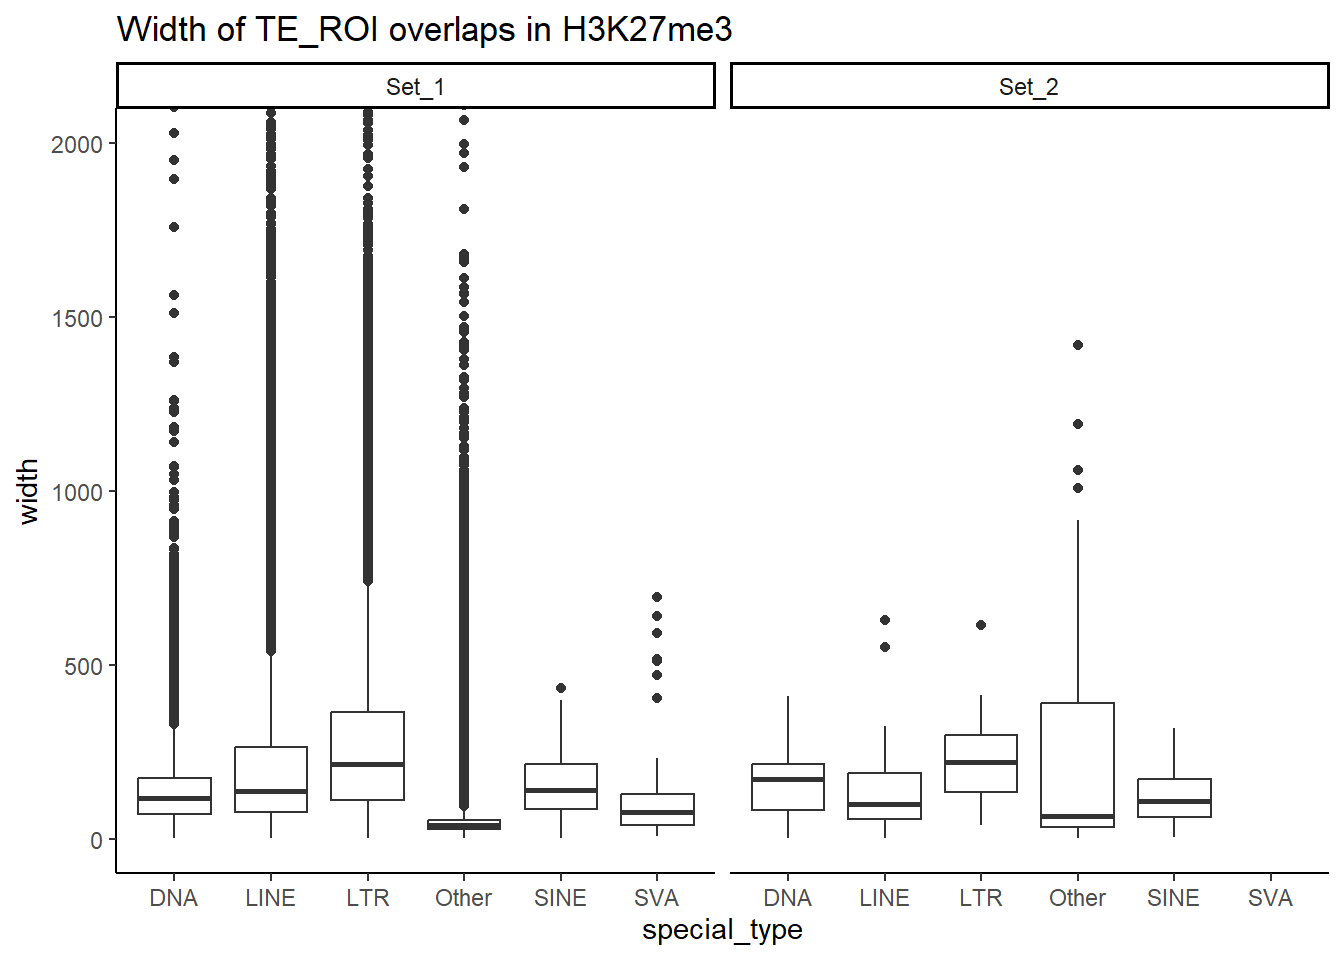
TSS distance
ungroup_H3K27me3_repclass %>%
   group_by(Peakid, special_type) %>%
  summarize(distanceToTSS=min(distanceToTSS),
            cluster=paste0(unique(cluster),collapse = ",")) %>%
  ggplot(aes(x=cluster,y=distanceToTSS))+
  geom_boxplot() +
  facet_wrap(~special_type)+
  theme_classic()+
    ggtitle("Distance to TSS by class in H3K27me3 of overlapping ROIs")+
  coord_cartesian(ylim=c(-35000,35000))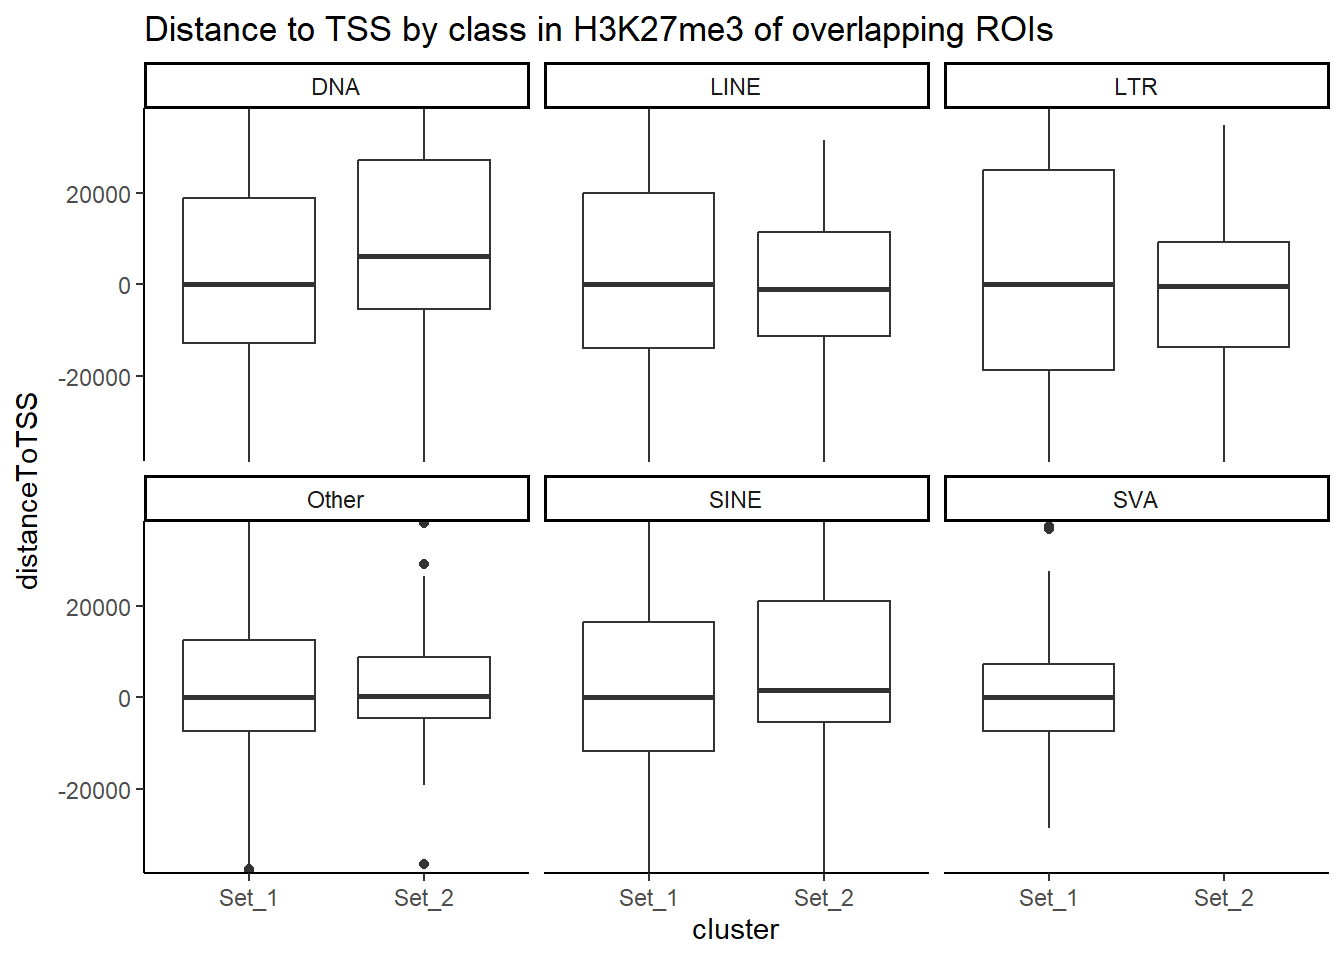
| Version | Author | Date |
|---|---|---|
| 1f6e044 | reneeisnowhere | 2025-10-03 |
distanceToTSS_H3K27me3 <- ungroup_H3K27me3_repclass %>%
 group_by(special_type) %>%
  group_map(~ {
    stype <- unique(.x$special_type)  # capture the TE type
    map_dfr(comparisons_2, function(comp) {
      dat <- .x %>% filter(cluster %in% comp)
       # Skip if both clusters are not present
      if(length(unique(dat$cluster)) < 2) return(NULL)
      test <- wilcox.test(distanceToTSS ~ cluster, data = dat)
      tibble(
        special_type = stype,
        comparison = paste(comp, collapse = "_vs_"),
        p.value = test$p.value,
        W = test$statistic,
        median_Set1 = median(dat$distanceToTSS[dat$cluster == "Set_1"]),
        median_other = median(dat$distanceToTSS[dat$cluster == comp[2]])
      )
    })
  }, .keep = TRUE) %>%
  bind_rows()


datatable( distanceToTSS_H3K27me3,caption = htmltools::tags$caption(
  style = 'caption-side: top; text-align: center; font-weight: bold;',
  "Wilcox test of Distance to TSS; H3K27me3",

))
Percent coverage of TE
ungroup_H3K27me3_repclass %>%
  ggplot(aes(x=cluster,y=pct_te_overlap))+
  geom_boxplot(aes(fill=cluster))+
  facet_wrap(~special_type)+
  theme_classic()+
ggtitle("Percent of TE overlapped in H3K27me3 data") 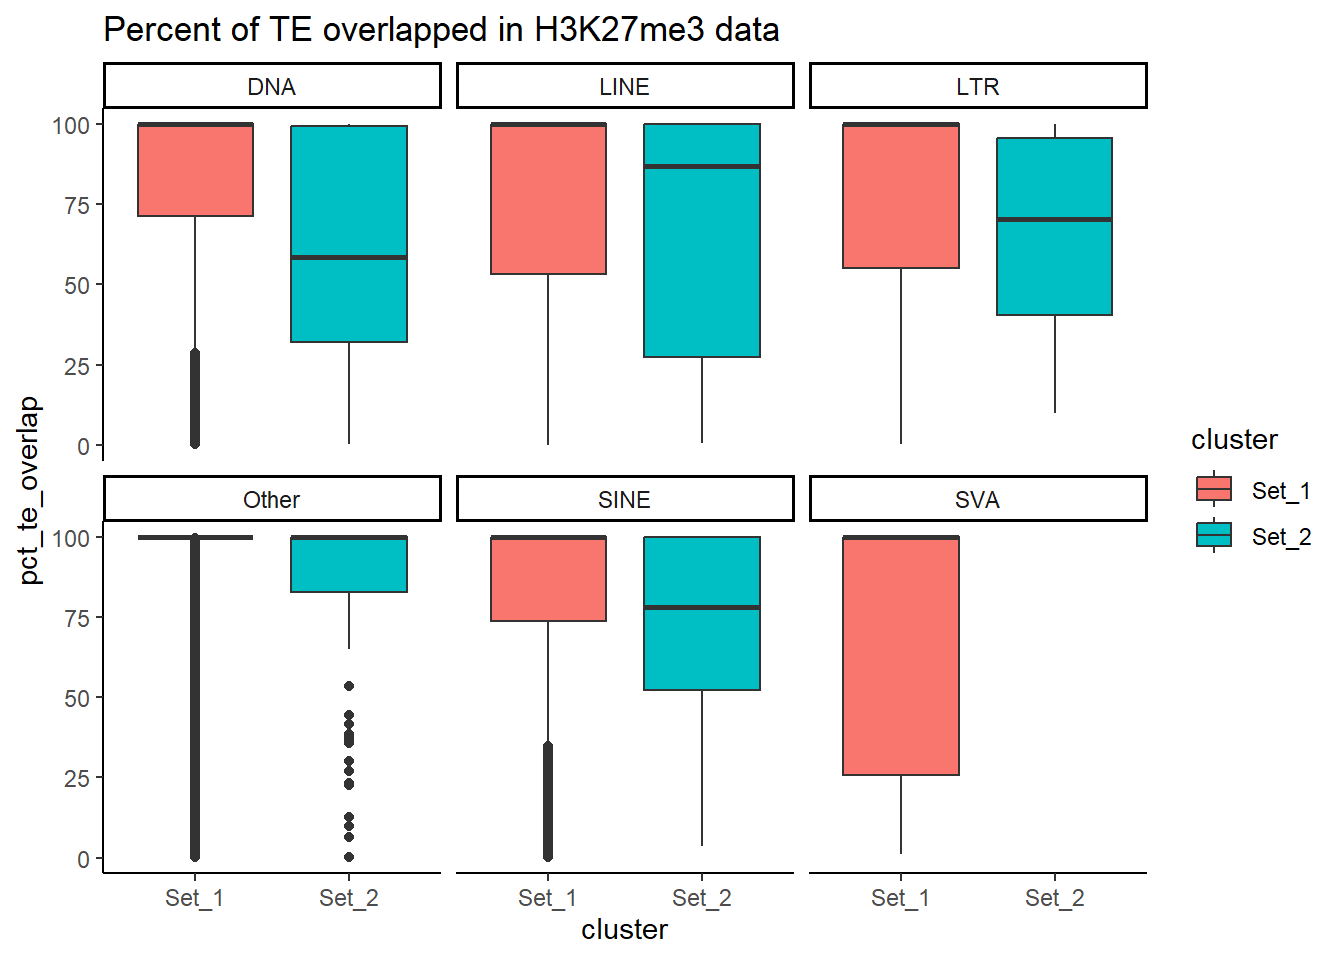
| Version | Author | Date |
|---|---|---|
| 1f6e044 | reneeisnowhere | 2025-10-03 |
ungroup_H3K27me3_repclass %>%
  dplyr::filter(special_type=="Other") %>%
  ggplot(aes(repFamily, y = pct_te_overlap))+
  geom_boxplot(aes(fill=cluster))+
  theme_classic()+
    ggtitle("Percent of TE (just the Others) overlapped in H3K27me3 data") +
  theme(axis.text.x = element_text(angle = 90, vjust = 0.5, hjust = 1) )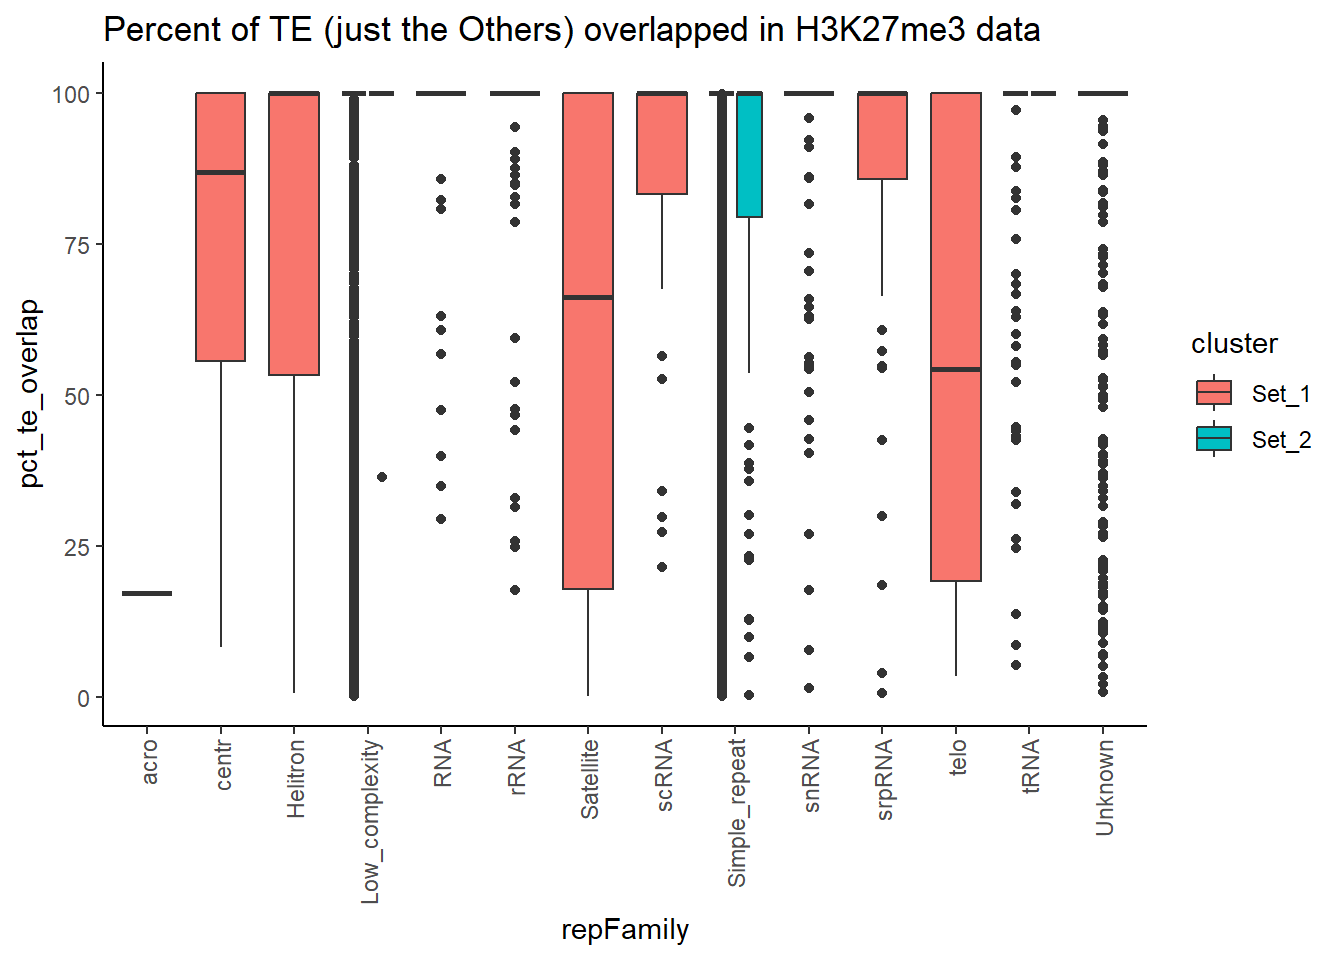
| Version | Author | Date |
|---|---|---|
| 1f6e044 | reneeisnowhere | 2025-10-03 |
Per_TE_cov_H3K27me3 <- ungroup_H3K27me3_repclass %>%
 group_by(special_type) %>%
  group_map(~ {
    stype <- unique(.x$special_type)  # capture the TE type
    map_dfr(comparisons_2, function(comp) {
      dat <- .x %>% filter(cluster %in% comp)
       # Skip if both clusters are not present
      if(length(unique(dat$cluster)) < 2) return(NULL)
      test <- wilcox.test(pct_te_overlap ~ cluster, data = dat)
      tibble(
        special_type = stype,
        comparison = paste(comp, collapse = "_vs_"),
        p.value = test$p.value,
        W = test$statistic,
        median_Set1 = median(dat$pct_te_overlap[dat$cluster == "Set_1"]),
        median_other = median(dat$pct_te_overlap[dat$cluster == comp[2]])
      )
    })
  }, .keep = TRUE) %>%
  bind_rows()


datatable( Per_TE_cov_H3K27me3,caption = htmltools::tags$caption(
  style = 'caption-side: top; text-align: center; font-weight: bold;',
  "Wilcox test of Percent of TE coverage; H3K27me3",

))
H3K36me3 lengths of TE, TSS distance
TE length
ungroup_H3K36me3_repclass <- H3K36me3_ols$all_H3K36me3 %>%
   left_join(., H3K36me3_lookup) %>%
     mutate(cluster = if_else(is.na(cluster), "not_assigned", cluster)) %>%
    mutate(special_type=case_when(str_detect("SINE", repClass)~"SINE",
                                  str_detect("LINE", repClass)~"LINE",
                                  str_detect("LTR", repClass)~"LTR",
                                  str_detect("DNA", repClass)~"DNA",
                                  str_detect("Retroposon", repClass)~"SVA",
                                  is.na(repClass)~"not_TE",
                                  TRUE~"Other"))%>%
  dplyr::filter(cluster != "not_assigned")

# H3K36me3_repclass_sum <- ungroup_H3K36me3_repclass %>%
#   group_by(Peakid, special_type) %>%
#   summarize(width= min(width),
#             min_te_len=min(te_len),
#             min_roi_len=min(roi_len),
#             min_overlap=min(overlap_bp),
#             min_dist_TSS=min(distanceToTSS),
#             max_dist_TSS=max(distanceToTSS),
#             cluster=paste0(unique(cluster), collapse = ":"))
#

# H3K36me3_repclass_sum %>%
#   ggplot(aes(x=special_type,y=min_te_len))+
#   geom_boxplot() +
#   facet_wrap(~cluster)+
#   theme_classic()+
#     ggtitle("Overlapping TE minimum length per class in H3K36me3")+
#    coord_cartesian(ylim=c(0,2500))

ungroup_H3K36me3_repclass %>%
  dplyr::select(seqnames, start, end, width, strand, Peakid, te_len, pct_te_overlap, repName, repClass, repFamily, milliDiv, milliDel, milliIns, cluster, special_type) %>%
  bind_rows(non_ol_H3K36me3_df) %>%
  ggplot(aes(x=cluster,y=te_len))+
  geom_boxplot(aes(fill=cluster)) +
  facet_wrap(~special_type)+
  theme_classic()+
    ggtitle("All overlapping TE lengths in H3K36me3")+
   coord_cartesian(ylim=c(0,2000))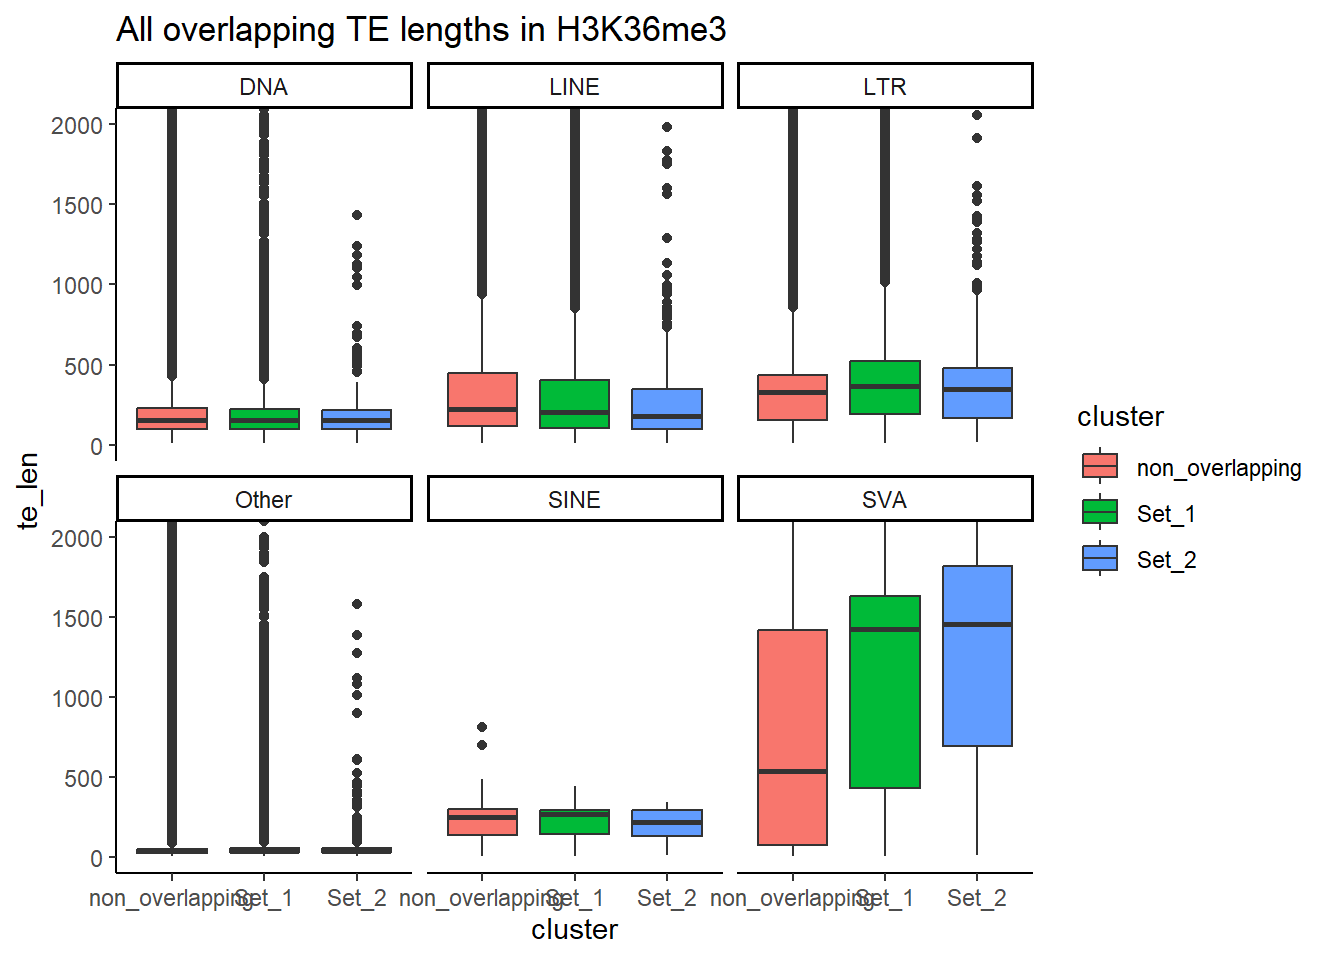
| Version | Author | Date |
|---|---|---|
| 1f6e044 | reneeisnowhere | 2025-10-03 |
H3K36me3_wilcox_te_len <- ungroup_H3K36me3_repclass %>%
    dplyr::filter(special_type != "not_TE") %>%
    filter(cluster %in% c("Set_1", "Set_2", "Set_3")) %>%
  group_by(special_type) %>%
  group_map(~ {
    stype <- unique(.x$special_type)  # capture the TE type
    map_dfr(comparisons_2, function(comp) {
      dat <- .x %>% filter(cluster %in% comp)

      # only run test if both groups are present
      if (length(unique(dat$cluster)) == 2) {
        test <- wilcox.test(te_len ~ cluster, data = dat)
        tibble(
          special_type = stype,
          comparison   = paste(comp, collapse = "_vs_"),
          p.value      = test$p.value,
          W            = test$statistic,
          median_Set1  = median(dat$te_len[dat$cluster == "Set_1"]),
          median_other = median(dat$te_len[dat$cluster == comp[2]])
        )
      } else {
        tibble(
          special_type = stype,
          comparison   = paste(comp, collapse = "_vs_"),
          p.value      = NA_real_,
          W            = NA_real_,
          median_Set1  = median(dat$te_len[dat$cluster == "Set_1"], na.rm = TRUE),
          median_other = median(dat$te_len[dat$cluster == comp[2]], na.rm = TRUE)
        )
      }
    })
  }, .keep = TRUE) %>%
  bind_rows()


 datatable( H3K36me3_wilcox_te_len,caption = htmltools::tags$caption(
  style = 'caption-side: top; text-align: center; font-weight: bold;',
  "Wilcox test on TE length  (>1 bp overlap) H3K36me3"
))
Peak length
All_H3K36me3_ROI_df <- H3K36me3_sets_gr$all_H3K36me3 %>%
  as.data.frame() %>%
   left_join(., H3K36me3_lookup) %>%
  mutate(cluster = if_else(is.na(cluster), "not_assigned", cluster))


All_H3K36me3_ROI_df %>%
    mutate(cluster="all_regions") %>%
  rbind(.,All_H3K36me3_ROI_df) %>%
  dplyr::filter(cluster != "not_assigned") %>%
  ggplot(aes(x=cluster, y=width))+
  geom_boxplot()+
  ggsignif::geom_signif(comparisons=list(c("all_regions","Set_1"),
                                      c("all_regions","Set_2")
                                     ),
                        y_position = c(2000, 2400, 2800))+
  theme_classic()+
    ggtitle(" All assigned ROI lengths in H3K36me3") +
  coord_cartesian(ylim=c(0,5000))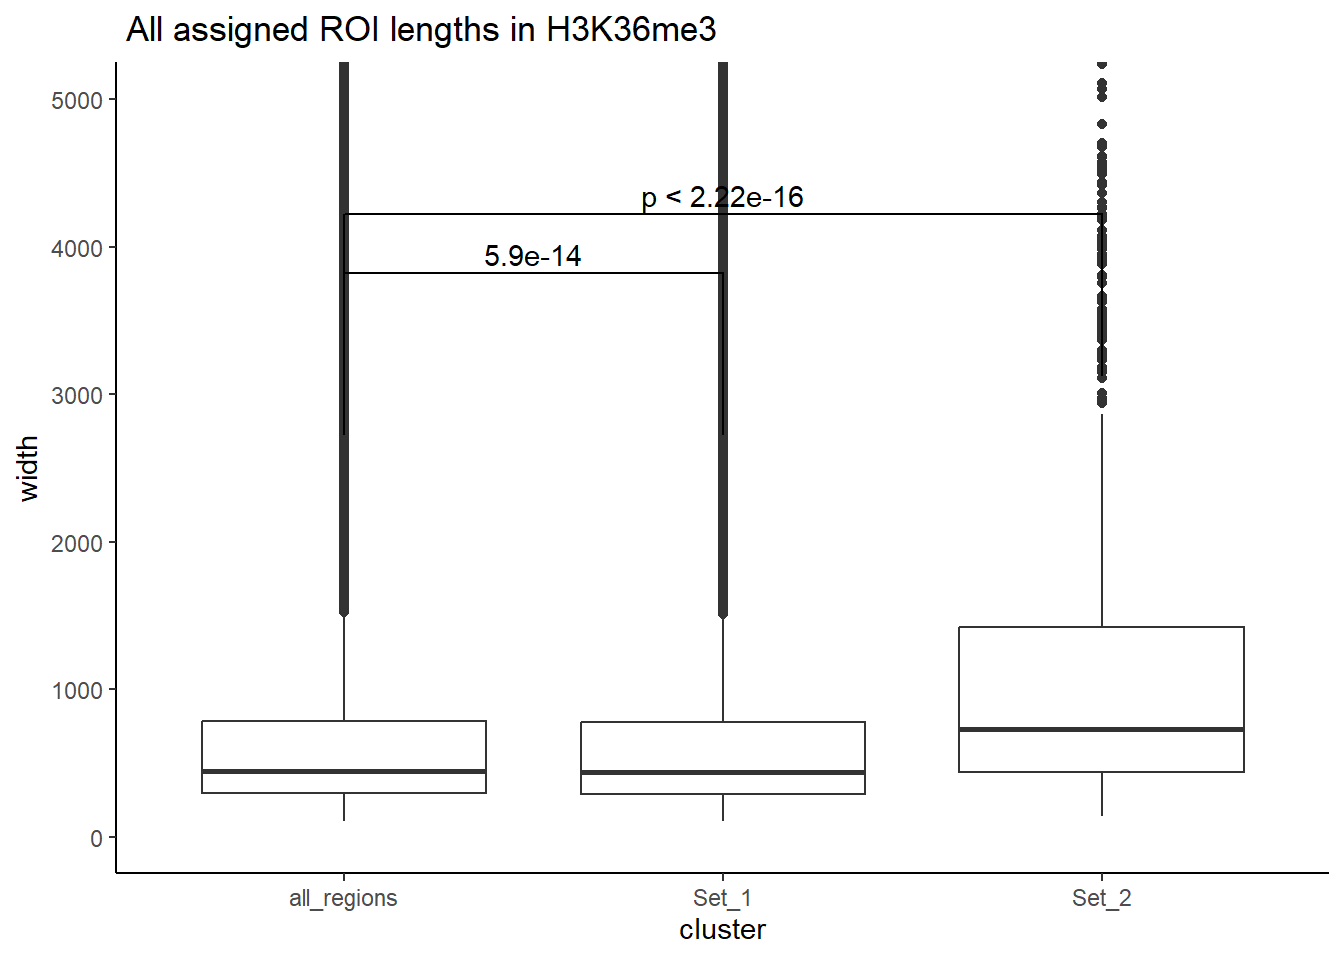
ungroup_H3K36me3_repclass %>%
  ggplot(aes(x=special_type,y=width))+
  geom_boxplot() +
  facet_wrap(~cluster)+
  theme_classic()+
    ggtitle("Width of TE_ROI overlaps in H3K36me3")+
  coord_cartesian(ylim=c(0,2000))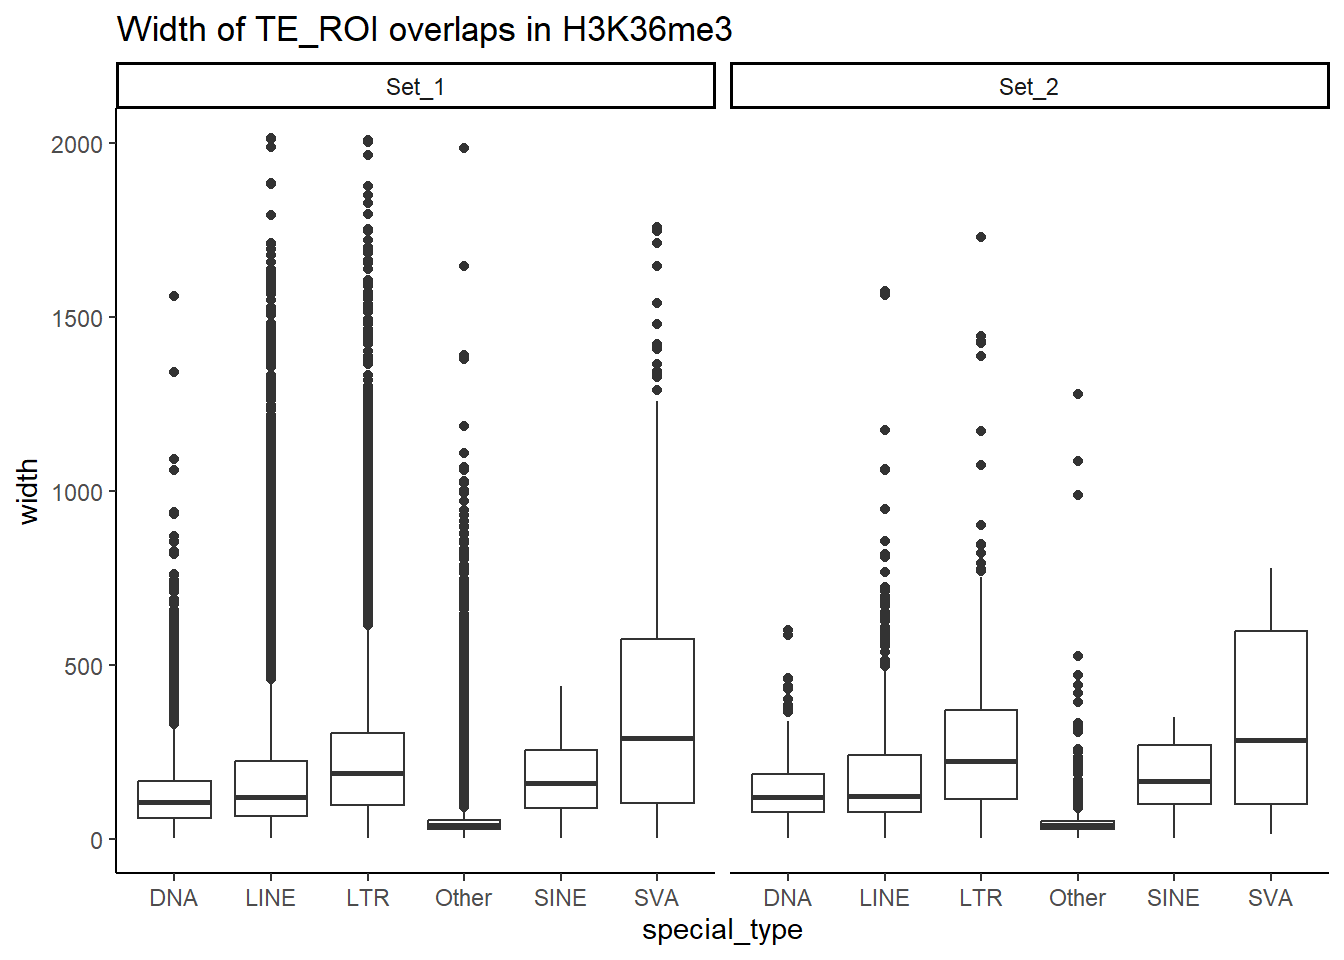
TSS distance
ungroup_H3K36me3_repclass %>%
   group_by(Peakid, special_type) %>%
  summarize(distanceToTSS=min(distanceToTSS),
            cluster=paste0(unique(cluster),collapse = ",")) %>%
  ggplot(aes(x=cluster,y=distanceToTSS))+
  geom_boxplot() +
  facet_wrap(~special_type)+
  theme_classic()+
    ggtitle("Distance to TSS by class in H3K36me3 of overlapping ROIs")+
  coord_cartesian(ylim=c(-35000,35000))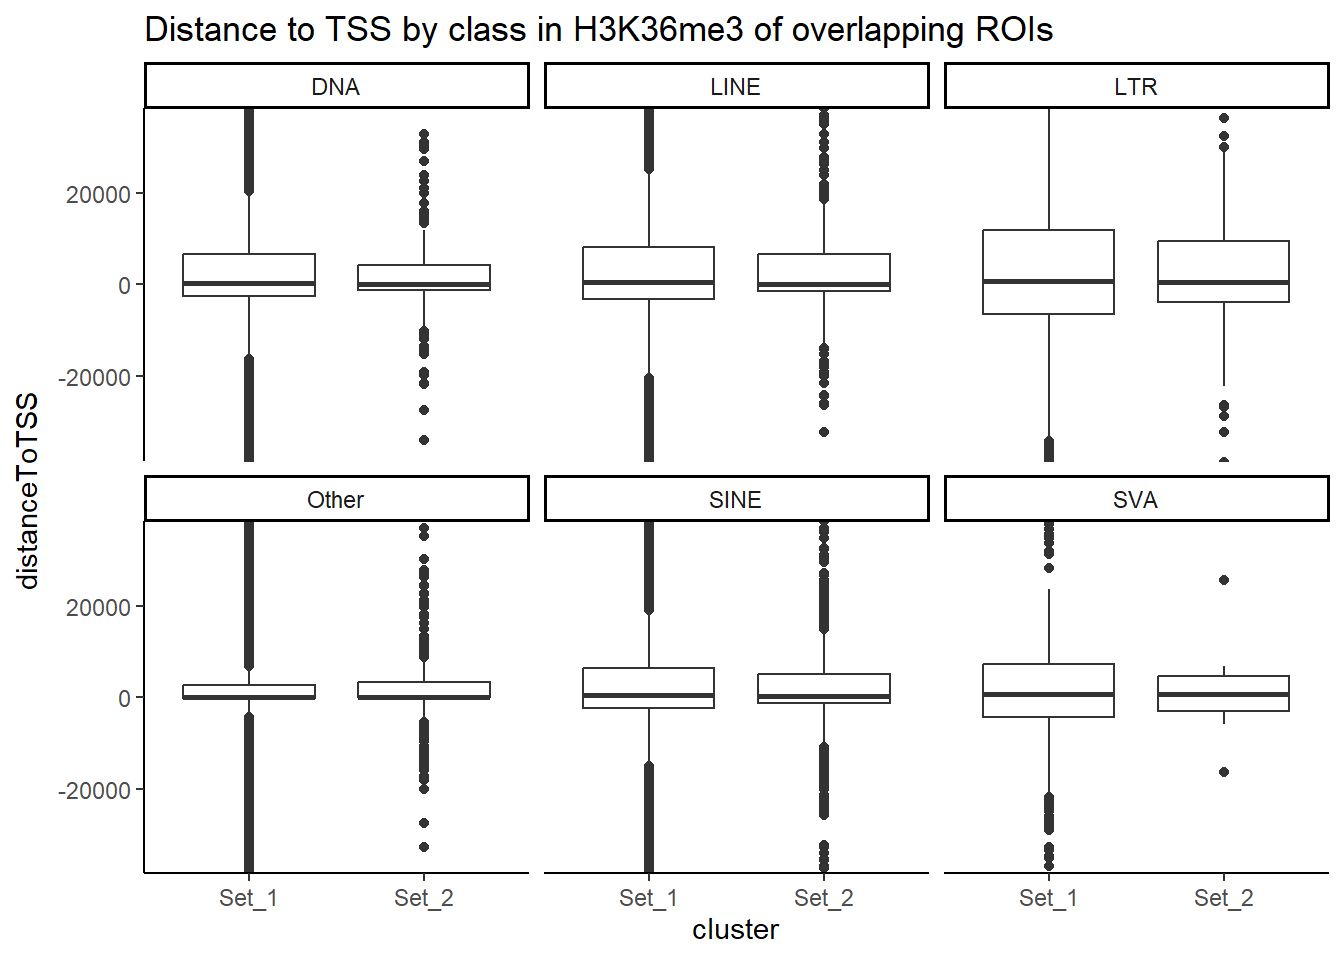
| Version | Author | Date |
|---|---|---|
| 1f6e044 | reneeisnowhere | 2025-10-03 |
distanceToTSS_H3K36me3 <- ungroup_H3K36me3_repclass %>%
 group_by(special_type) %>%
  group_map(~ {
    stype <- unique(.x$special_type)  # capture the TE type
    map_dfr(comparisons_2, function(comp) {
      dat <- .x %>% filter(cluster %in% comp)
       # Skip if both clusters are not present
      if(length(unique(dat$cluster)) < 2) return(NULL)
      test <- wilcox.test(distanceToTSS ~ cluster, data = dat)
      tibble(
        special_type = stype,
        comparison = paste(comp, collapse = "_vs_"),
        p.value = test$p.value,
        W = test$statistic,
        median_Set1 = median(dat$distanceToTSS[dat$cluster == "Set_1"]),
        median_other = median(dat$distanceToTSS[dat$cluster == comp[2]])
      )
    })
  }, .keep = TRUE) %>%
  bind_rows()


datatable( distanceToTSS_H3K36me3,caption = htmltools::tags$caption(
  style = 'caption-side: top; text-align: center; font-weight: bold;',
  "Wilcox test of Distance to TSS; H3K36me3",

))
Percent coverage of TE
ungroup_H3K36me3_repclass %>%
  ggplot(aes(x=cluster,y=pct_te_overlap))+
  geom_boxplot(aes(fill=cluster))+
  facet_wrap(~special_type)+
  theme_classic()+
ggtitle("Percent of TE overlapped in H3K36me3 data") 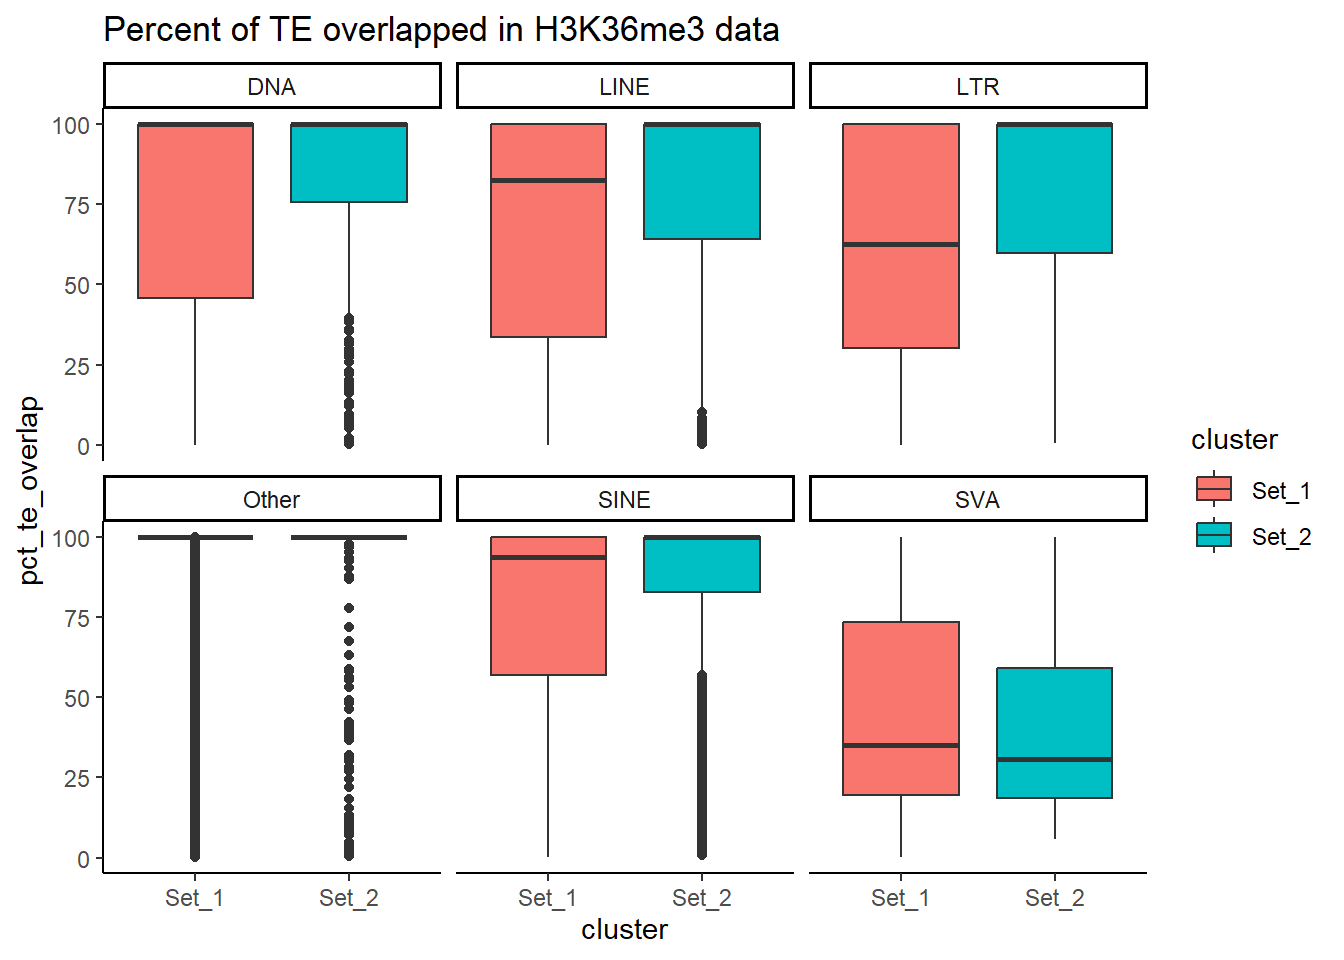
| Version | Author | Date |
|---|---|---|
| 1f6e044 | reneeisnowhere | 2025-10-03 |
ungroup_H3K36me3_repclass %>%
  dplyr::filter(special_type=="Other") %>%
  ggplot(aes(cluster, y = pct_te_overlap))+
  geom_boxplot(aes(fill=cluster))+
  facet_wrap(~repFamily, ncol=5)+
  theme_classic()+
    ggtitle("Percent of TE (just the Others) overlapped in H3K36me3 data") +
  theme(axis.text.x = element_text(angle = 90, vjust = 0.5, hjust = 1) )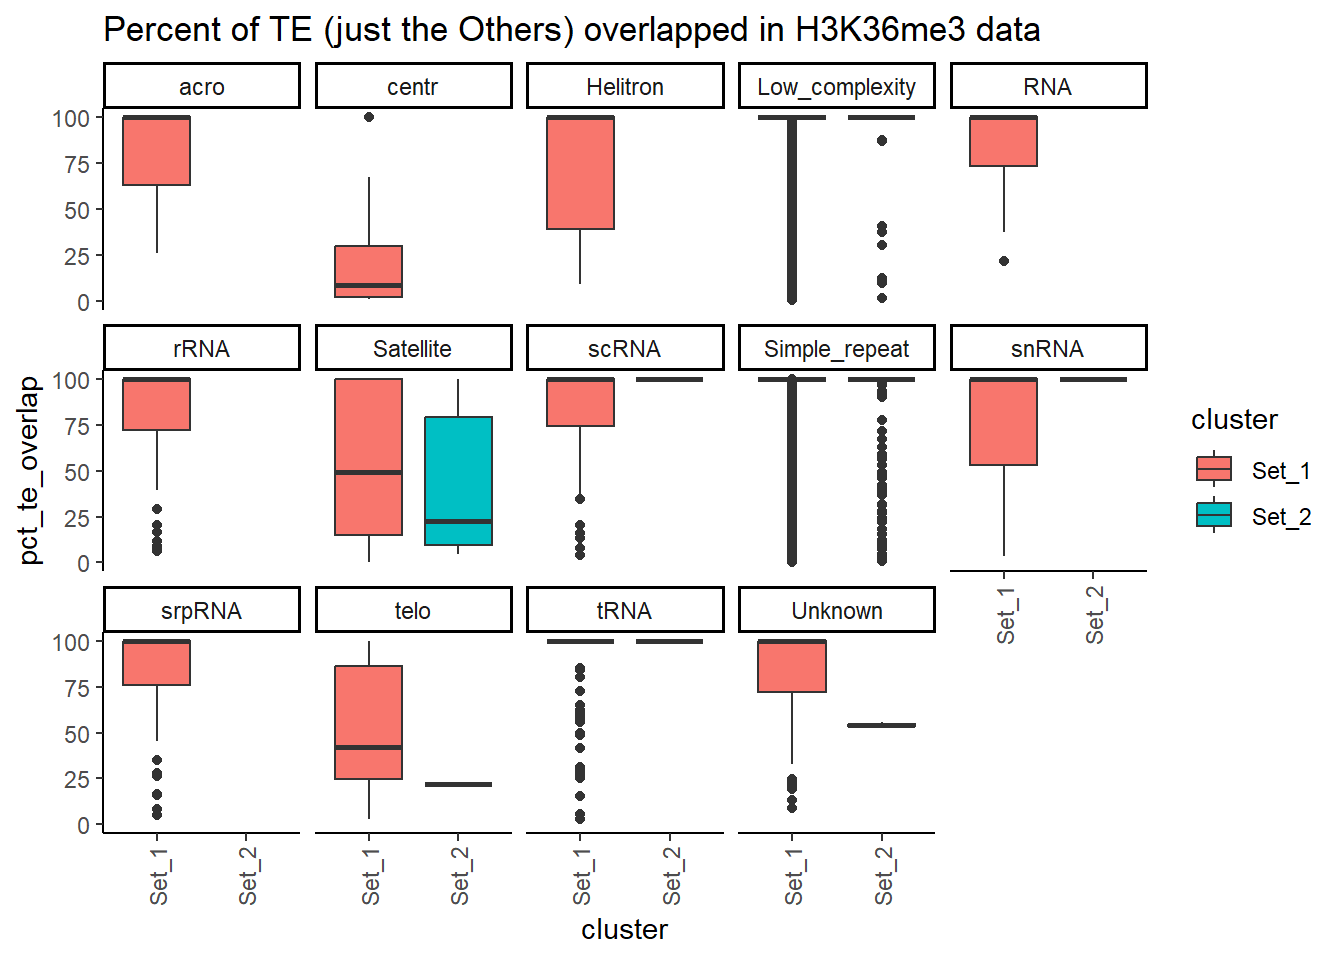
| Version | Author | Date |
|---|---|---|
| 1f6e044 | reneeisnowhere | 2025-10-03 |
Per_TE_cov_H3K36me3 <- ungroup_H3K36me3_repclass %>%
 group_by(special_type) %>%
  group_map(~ {
    stype <- unique(.x$special_type)  # capture the TE type
    map_dfr(comparisons_2, function(comp) {
      dat <- .x %>% filter(cluster %in% comp)
       # Skip if both clusters are not present
      if(length(unique(dat$cluster)) < 2) return(NULL)
      test <- wilcox.test(pct_te_overlap ~ cluster, data = dat)
      tibble(
        special_type = stype,
        comparison = paste(comp, collapse = "_vs_"),
        p.value = test$p.value,
        W = test$statistic,
        median_Set1 = median(dat$pct_te_overlap[dat$cluster == "Set_1"]),
        median_other = median(dat$pct_te_overlap[dat$cluster == comp[2]])
      )
    })
  }, .keep = TRUE) %>%
  bind_rows()


datatable( Per_TE_cov_H3K36me3,caption = htmltools::tags$caption(
  style = 'caption-side: top; text-align: center; font-weight: bold;',
  "Wilcox test of Percent of TE coverage; H3K36me3",

))
H3K9me3 lengths of TE, TSS distance
TE length
ungroup_H3K9me3_repclass <- H3K9me3_ols$all_H3K9me3 %>%
   left_join(., H3K9me3_lookup) %>%
     mutate(cluster = if_else(is.na(cluster), "not_assigned", cluster)) %>%
    mutate(special_type=case_when(str_detect("SINE", repClass)~"SINE",
                                  str_detect("LINE", repClass)~"LINE",
                                  str_detect("LTR", repClass)~"LTR",
                                  str_detect("DNA", repClass)~"DNA",
                                  str_detect("Retroposon", repClass)~"SVA",
                                  is.na(repClass)~"not_TE",
                                  TRUE~"Other"))%>%
  dplyr::filter(cluster != "not_assigned")

# H3K9me3_repclass_sum <- ungroup_H3K9me3_repclass %>%
#   group_by(Peakid, special_type) %>%
#   summarize(width= min(width),
#             min_te_len=min(te_len),
#             min_roi_len=min(roi_len),
#             min_overlap=min(overlap_bp),
#             min_dist_TSS=min(distanceToTSS),
#             max_dist_TSS=max(distanceToTSS),
#             cluster=paste0(unique(cluster), collapse = ":"))
#

# H3K9me3_repclass_sum %>%
#   ggplot(aes(x=special_type,y=min_te_len))+
#   geom_boxplot() +
#   facet_wrap(~cluster)+
#   theme_classic()+
#     ggtitle("Overlapping TE minimum length per class in H3K9me3")+
#    coord_cartesian(ylim=c(0,2500))

ungroup_H3K9me3_repclass %>%
  dplyr::select(seqnames, start, end, width, strand, Peakid, te_len, pct_te_overlap, repName, repClass, repFamily, milliDiv, milliDel, milliIns, cluster, special_type) %>%
  bind_rows(non_ol_H3K9me3_df) %>%
  ggplot(aes(x=cluster,y=te_len))+
  geom_boxplot() +
  facet_wrap(~special_type)+
  theme_classic()+
    ggtitle("All overlapping TE lengths in H3K9me3")+
   coord_cartesian(ylim=c(0,2000))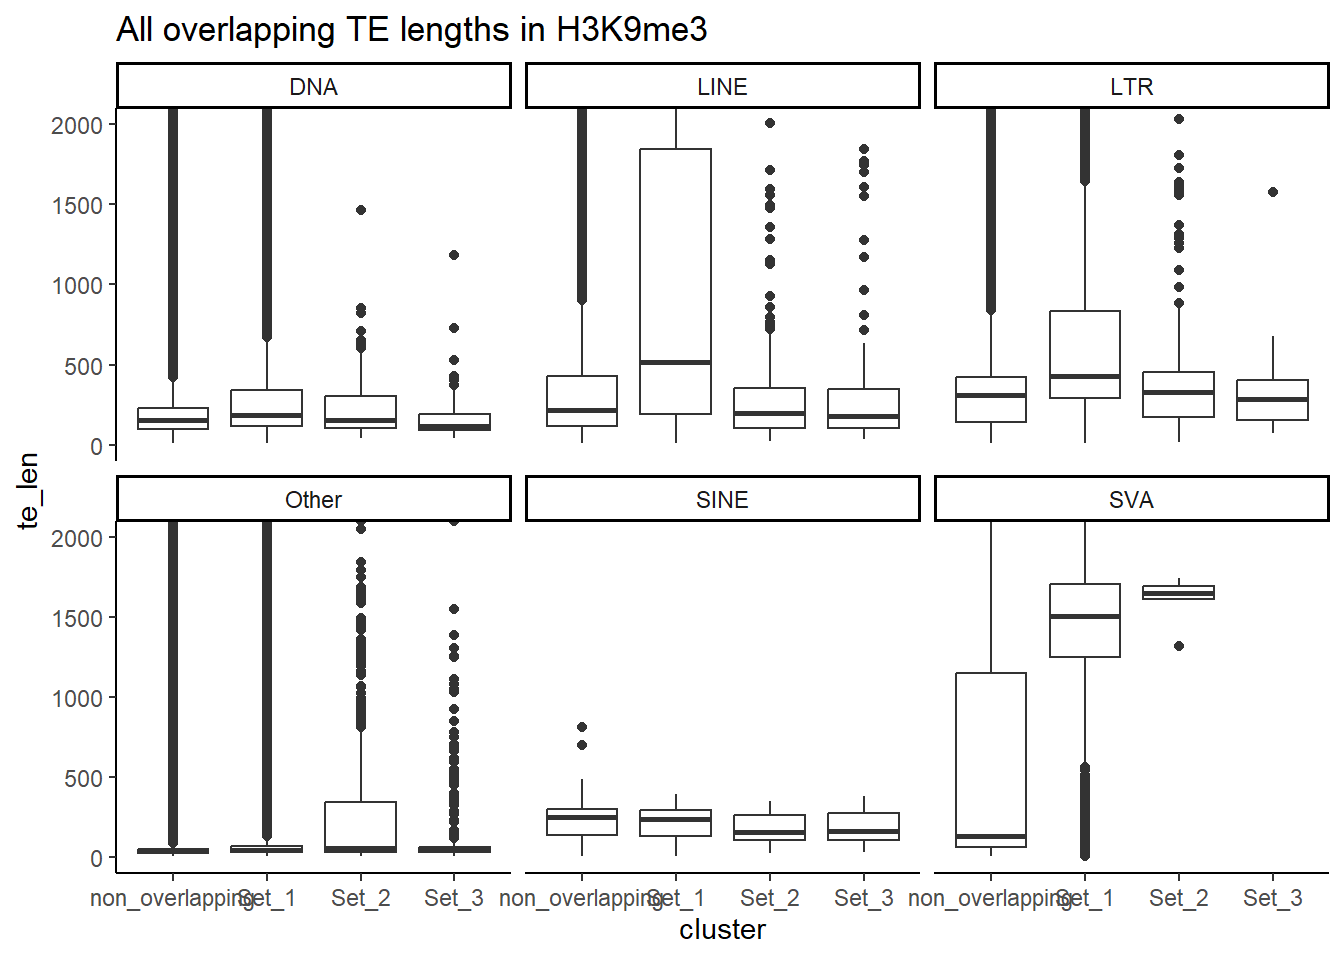
| Version | Author | Date |
|---|---|---|
| 1f6e044 | reneeisnowhere | 2025-10-03 |
H3K9me3_wilcox_te_len <- ungroup_H3K9me3_repclass %>%
    dplyr::filter(special_type != "not_TE") %>%
    filter(cluster %in% c("Set_1", "Set_2", "Set_3")) %>%
  group_by(special_type) %>%
  group_map(~ {
    stype <- unique(.x$special_type)  # capture the TE type
    map_dfr(comparisons, function(comp) {
      dat <- .x %>% filter(cluster %in% comp)

      # only run test if both groups are present
      if (length(unique(dat$cluster)) == 2) {
        test <- wilcox.test(te_len ~ cluster, data = dat)
        tibble(
          special_type = stype,
          comparison   = paste(comp, collapse = "_vs_"),
          p.value      = test$p.value,
          W            = test$statistic,
          median_Set1  = median(dat$te_len[dat$cluster == "Set_1"]),
          median_other = median(dat$te_len[dat$cluster == comp[2]])
        )
      } else {
        tibble(
          special_type = stype,
          comparison   = paste(comp, collapse = "_vs_"),
          p.value      = NA_real_,
          W            = NA_real_,
          median_Set1  = median(dat$te_len[dat$cluster == "Set_1"], na.rm = TRUE),
          median_other = median(dat$te_len[dat$cluster == comp[2]], na.rm = TRUE)
        )
      }
    })
  }, .keep = TRUE) %>%
  bind_rows()

 datatable( H3K9me3_wilcox_te_len,caption = htmltools::tags$caption(
  style = 'caption-side: top; text-align: center; font-weight: bold;',
  "Wilcox test on TE length  (>1 bp overlap) H3K9me3"
))
Peak length
All_H3K9me3_ROI_df <- H3K9me3_sets_gr$all_H3K9me3 %>%
  as.data.frame() %>%
   left_join(., H3K9me3_lookup) %>%
  mutate(cluster = if_else(is.na(cluster), "not_assigned", cluster))


All_H3K9me3_ROI_df %>%
  mutate(cluster="all_regions") %>%
  rbind(.,All_H3K9me3_ROI_df) %>%
  dplyr::filter(cluster != "not_assigned") %>%
  ggplot(aes(x=cluster, y=width))+
  geom_boxplot()+
  ggsignif::geom_signif(comparisons=list(c("all_regions","Set_1"),
                                      c("all_regions","Set_2"),
                                      c("all_regions","Set_3")),
                        y_position = c(2000, 2400, 2800),
                        tip_length = 0.01)+
  theme_classic()+
    ggtitle(" All assigned ROI lengths in H3K9me3") +
  coord_cartesian(ylim=c(0,5000))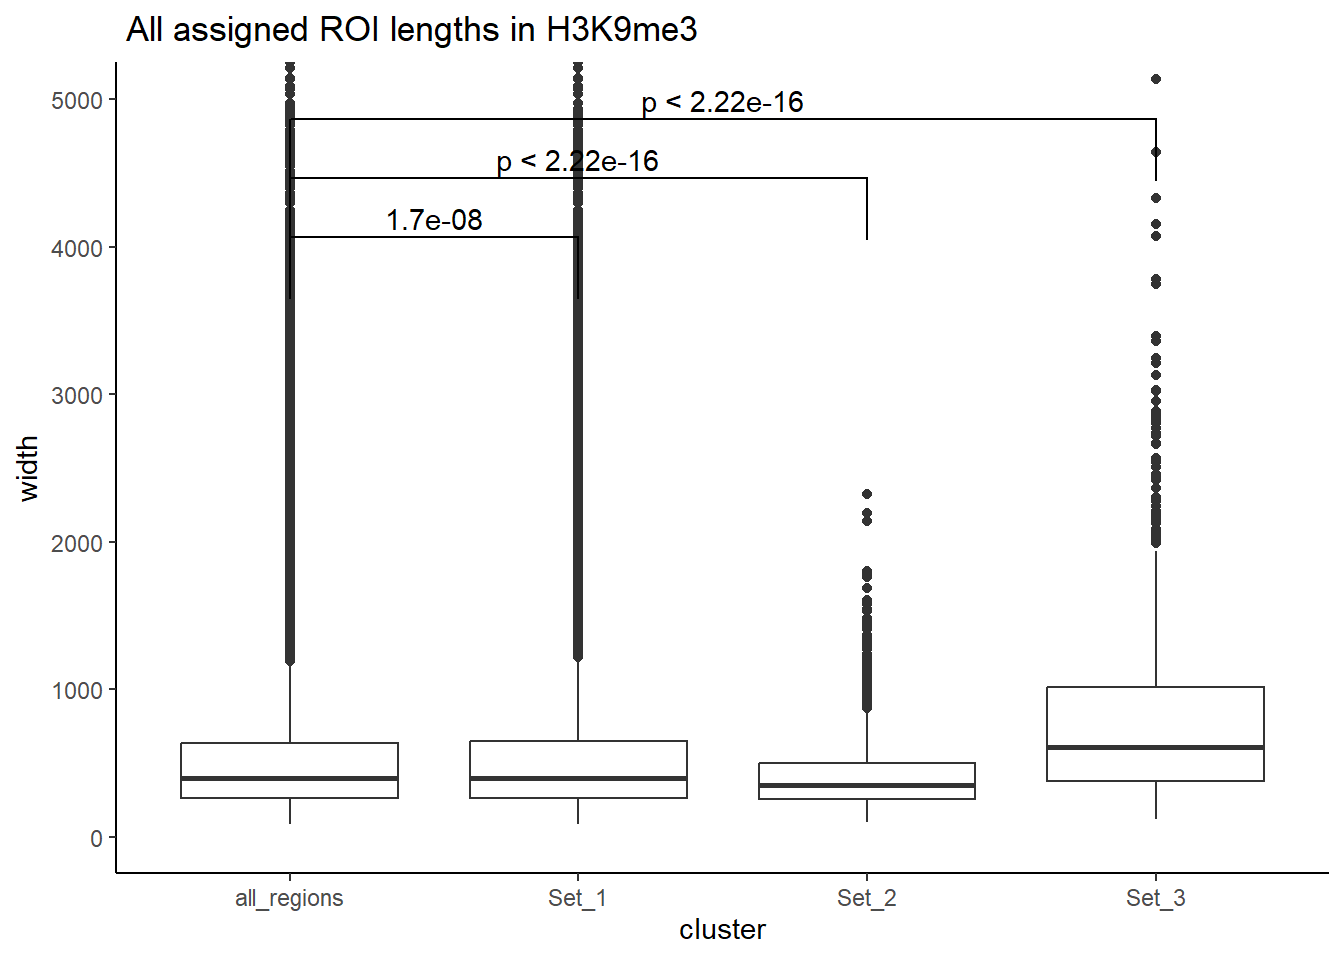
ungroup_H3K9me3_repclass %>%
  ggplot(aes(x=special_type,y=width))+
  geom_boxplot() +
  facet_wrap(~cluster)+
  theme_classic()+
    ggtitle("Width of TE_ROI overlaps in H3K9me3")+
  coord_cartesian(ylim=c(0,2000))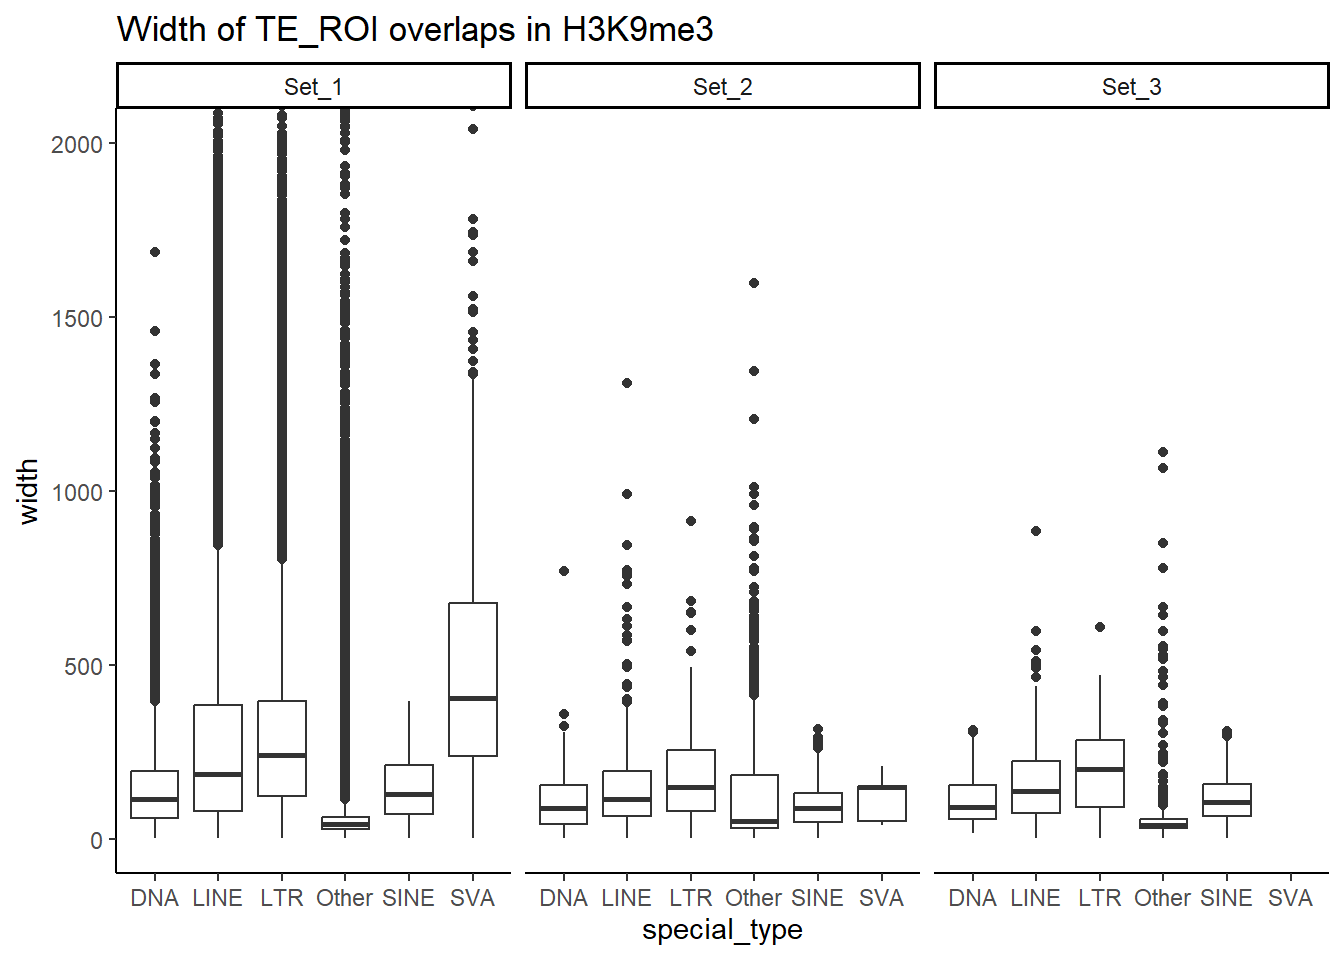
TSS distance
ungroup_H3K9me3_repclass %>%
  ggplot(aes(x=cluster,y=distanceToTSS))+
  geom_boxplot(aes(fill=cluster)) +
  geom_signif(comparisons = list(c("Set_1","Set_2"),
                                  c("Set_1","Set_3")),

              map_signif_level = FALSE,
              test = "wilcox.test",
              y_position = c(10,50,100))+# note values are scaled internally by geomsignif
              # step_increase = 0.1)+
  facet_wrap(~special_type)+
  theme_classic()+
    ggtitle("Distance to TSS by class in H3K9me3 of overlapping ROIs")+
  coord_cartesian(ylim=c(-45000,45000))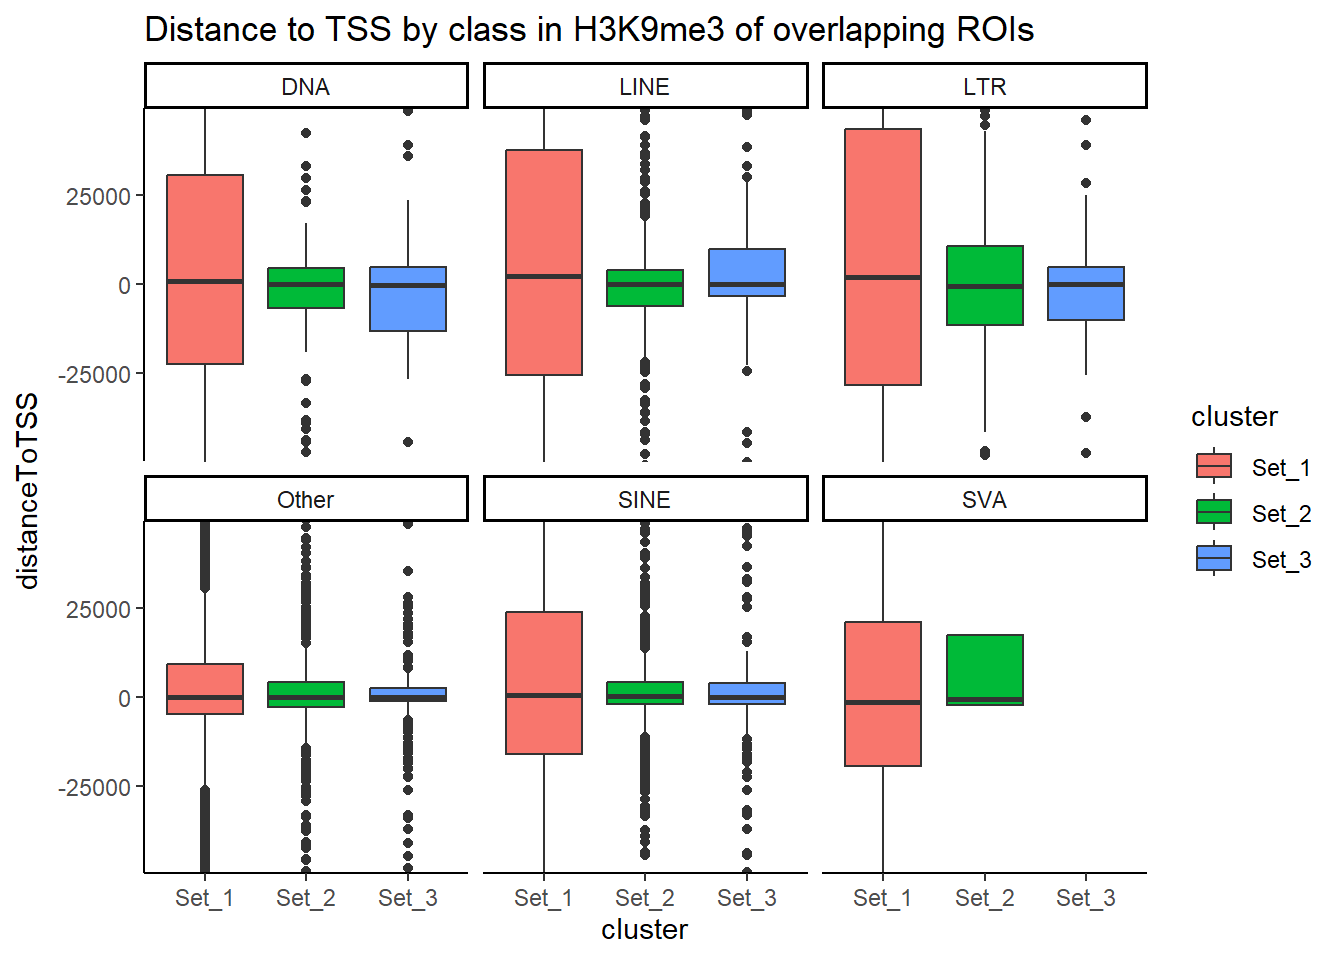
| Version | Author | Date |
|---|---|---|
| 1f6e044 | reneeisnowhere | 2025-10-03 |
ungroup_H3K9me3_repclass %>%
  ggplot(aes(x=cluster,y=distanceToTSS))+
  geom_boxplot(aes(fill=cluster)) +
  geom_signif(comparisons = list(c("Set_1","Set_2"),
                                  c("Set_1","Set_3")),

              map_signif_level = FALSE,
              test = "wilcox.test",
              # y_position = c(10,50,100))+# note values are scaled internally by geomsignif
              step_increase = 0.1)+
  facet_wrap(~special_type)+
  theme_classic()+
    ggtitle("Distance to TSS by class in H3K9me3 of overlapping ROIs")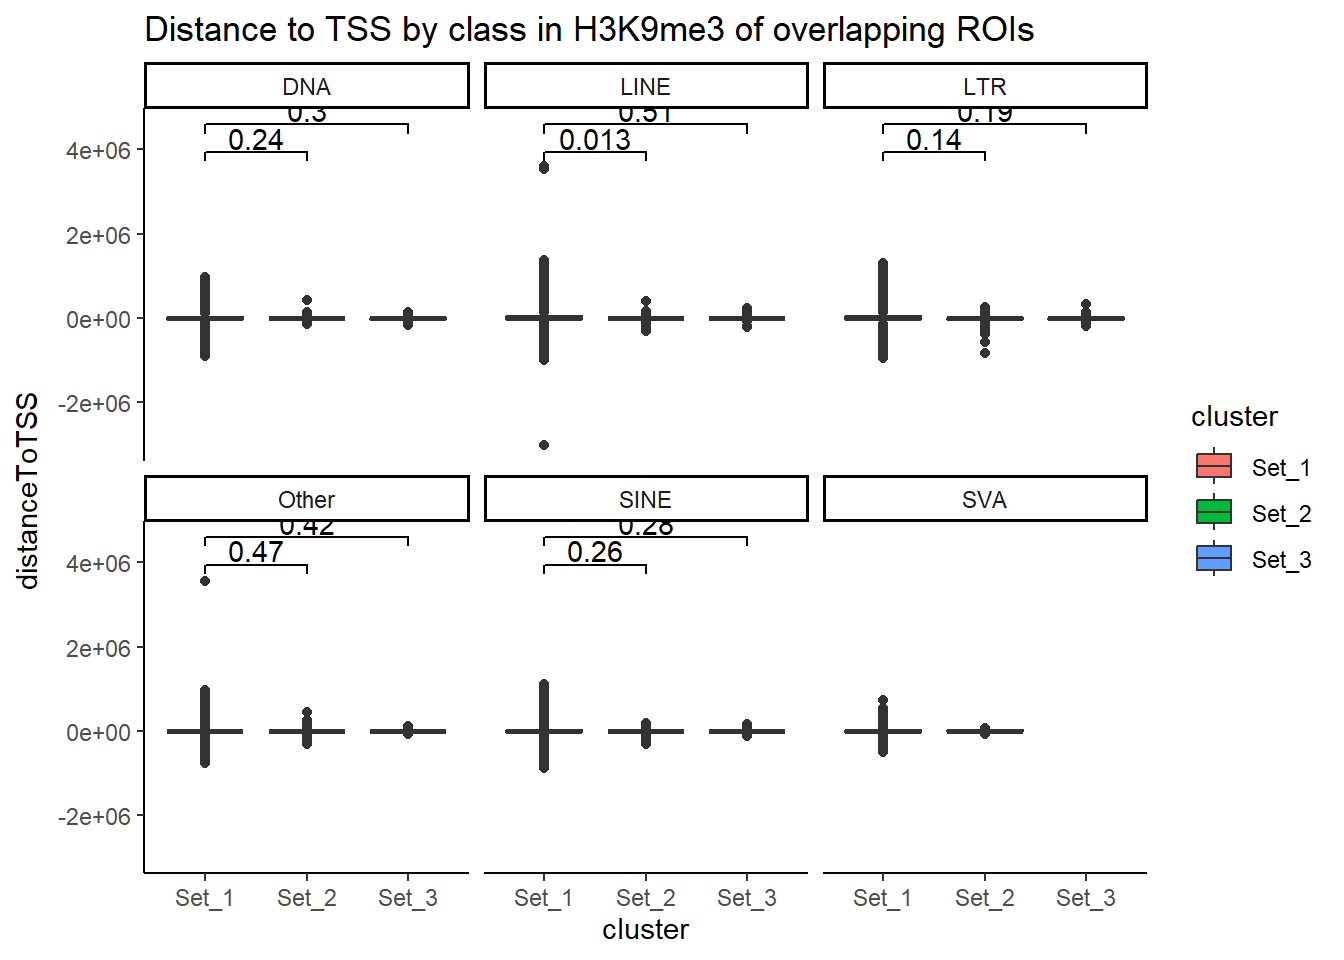
| Version | Author | Date |
|---|---|---|
| 1f6e044 | reneeisnowhere | 2025-10-03 |
distanceToTSS_H3K9me3 <- ungroup_H3K9me3_repclass %>%
 group_by(special_type) %>%
  group_map(~ {
    stype <- unique(.x$special_type)  # capture the TE type
    map_dfr(comparisons, function(comp) {
      dat <- .x %>% filter(cluster %in% comp)
       # Skip if both clusters are not present
      if(length(unique(dat$cluster)) < 2) return(NULL)
      test <- wilcox.test(distanceToTSS ~ cluster, data = dat)
      tibble(
        special_type = stype,
        comparison = paste(comp, collapse = "_vs_"),
        p.value = test$p.value,
        W = test$statistic,
        median_Set1 = median(dat$distanceToTSS[dat$cluster == "Set_1"]),
        median_other = median(dat$distanceToTSS[dat$cluster == comp[2]])
      )
    })
  }, .keep = TRUE) %>%
  bind_rows()


datatable( distanceToTSS_H3K9me3,caption = htmltools::tags$caption(
  style = 'caption-side: top; text-align: center; font-weight: bold;',
  "Wilcox test of Distance to TSS; H3K9me3",

))
Percent coverage of TE
ungroup_H3K9me3_repclass %>%
  ggplot(aes(x=cluster,y=pct_te_overlap))+
  geom_boxplot(aes(fill=cluster))+
  facet_wrap(~special_type)+
  theme_classic()+
ggtitle("Percent of TE overlapped in H3K9me3 data") 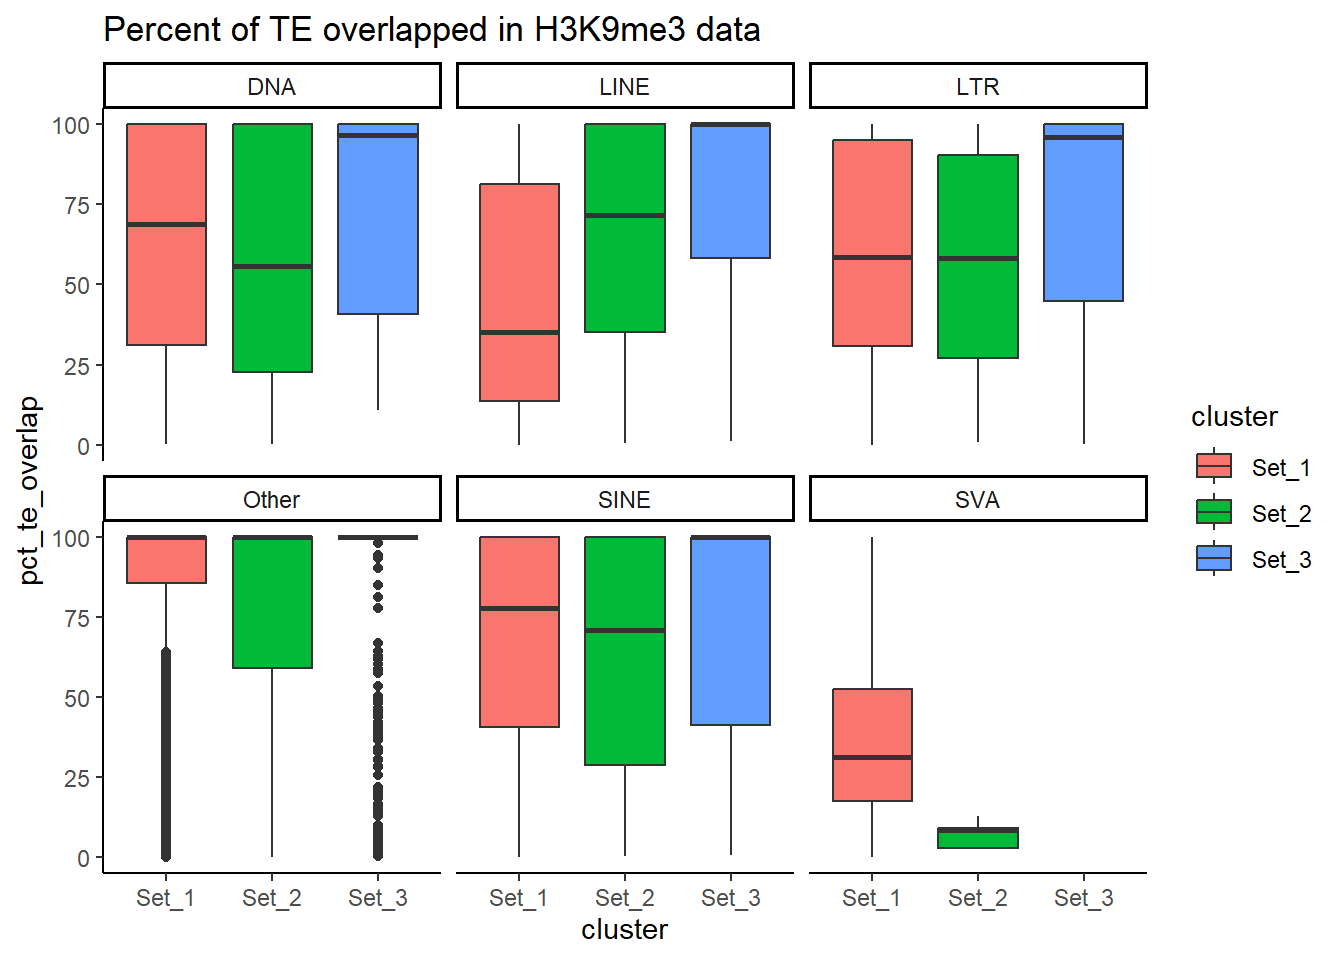
| Version | Author | Date |
|---|---|---|
| 1f6e044 | reneeisnowhere | 2025-10-03 |
ungroup_H3K9me3_repclass %>%
  dplyr::filter(special_type=="Other") %>%
  ggplot(aes(cluster, y = pct_te_overlap))+
  geom_boxplot(aes(fill=cluster))+
  facet_wrap(~repFamily, ncol=5)+
  theme_classic()+
    ggtitle("Percent of TE (just the Others) overlapped in H3K9me3 data") +
  theme(axis.text.x = element_text(angle = 90, vjust = 0.5, hjust = 1) )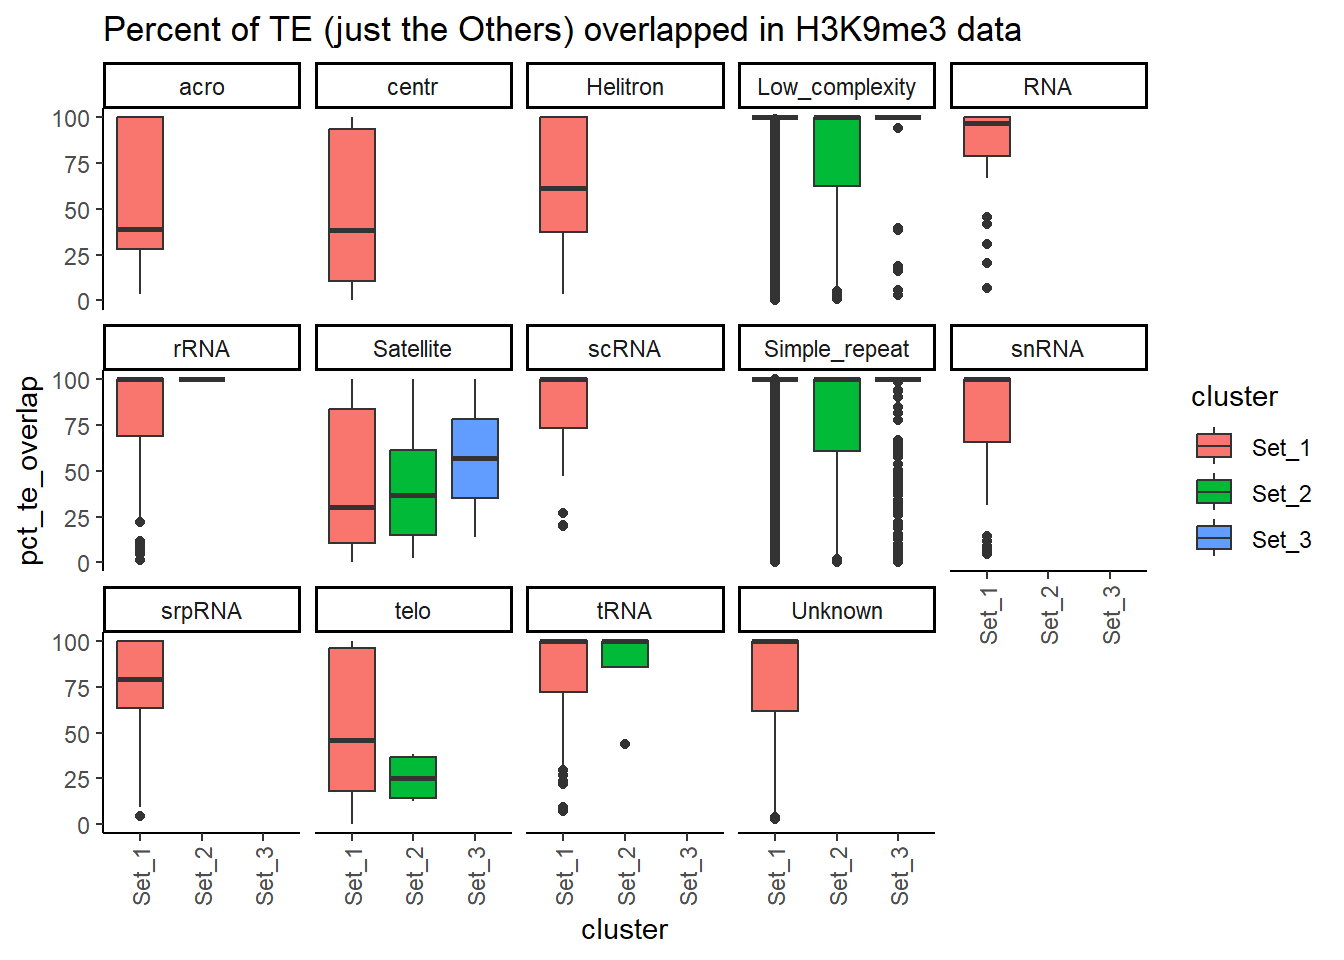
| Version | Author | Date |
|---|---|---|
| 1f6e044 | reneeisnowhere | 2025-10-03 |
Per_TE_cov_H3K9me3 <- ungroup_H3K9me3_repclass %>%
 group_by(special_type) %>%
  group_map(~ {
    stype <- unique(.x$special_type)  # capture the TE type
    map_dfr(comparisons, function(comp) {
      dat <- .x %>% filter(cluster %in% comp)
       # Skip if both clusters are not present
      if(length(unique(dat$cluster)) < 2) return(NULL)
      test <- wilcox.test(pct_te_overlap ~ cluster, data = dat)
      tibble(
        special_type = stype,
        comparison = paste(comp, collapse = "_vs_"),
        p.value = test$p.value,
        W = test$statistic,
        median_Set1 = median(dat$pct_te_overlap[dat$cluster == "Set_1"]),
        median_other = median(dat$pct_te_overlap[dat$cluster == comp[2]])
      )
    })
  }, .keep = TRUE) %>%
  bind_rows()


datatable( Per_TE_cov_H3K9me3,caption = htmltools::tags$caption(
  style = 'caption-side: top; text-align: center; font-weight: bold;',
  "Wilcox test of Percent of TE coverage; H3K9me3",

))
sessionInfo()R version 4.4.2 (2024-10-31 ucrt)
Platform: x86_64-w64-mingw32/x64
Running under: Windows 11 x64 (build 26200)
Matrix products: default
locale:
[1] LC_COLLATE=English_United States.utf8
[2] LC_CTYPE=English_United States.utf8
[3] LC_MONETARY=English_United States.utf8
[4] LC_NUMERIC=C
[5] LC_TIME=English_United States.utf8
time zone: America/Chicago
tzcode source: internal
attached base packages:
[1] stats4 grid stats graphics grDevices utils datasets
[8] methods base
other attached packages:
[1] ggrepel_0.9.6
[2] ggpubr_0.6.1
[3] ggsignif_0.6.4
[4] plyranges_1.26.0
[5] ChIPseeker_1.42.1
[6] TxDb.Hsapiens.UCSC.hg38.knownGene_3.20.0
[7] GenomicFeatures_1.58.0
[8] AnnotationDbi_1.68.0
[9] Biobase_2.66.0
[10] BiocParallel_1.40.2
[11] GenomicRanges_1.58.0
[12] GenomeInfoDb_1.42.3
[13] IRanges_2.40.1
[14] S4Vectors_0.44.0
[15] BiocGenerics_0.52.0
[16] genomation_1.38.0
[17] DT_0.33
[18] lubridate_1.9.4
[19] forcats_1.0.0
[20] stringr_1.5.1
[21] dplyr_1.1.4
[22] purrr_1.1.0
[23] readr_2.1.5
[24] tidyr_1.3.1
[25] tibble_3.3.0
[26] ggplot2_3.5.2
[27] tidyverse_2.0.0
[28] workflowr_1.7.1
loaded via a namespace (and not attached):
[1] splines_4.4.2
[2] later_1.4.2
[3] BiocIO_1.16.0
[4] bitops_1.0-9
[5] ggplotify_0.1.2
[6] R.oo_1.27.1
[7] XML_3.99-0.18
[8] lifecycle_1.0.4
[9] rstatix_0.7.2
[10] rprojroot_2.1.1
[11] processx_3.8.6
[12] lattice_0.22-7
[13] vroom_1.6.5
[14] crosstalk_1.2.2
[15] backports_1.5.0
[16] magrittr_2.0.3
[17] sass_0.4.10
[18] rmarkdown_2.29
[19] jquerylib_0.1.4
[20] yaml_2.3.10
[21] plotrix_3.8-4
[22] httpuv_1.6.16
[23] ggtangle_0.0.7
[24] cowplot_1.2.0
[25] DBI_1.2.3
[26] RColorBrewer_1.1-3
[27] abind_1.4-8
[28] zlibbioc_1.52.0
[29] R.utils_2.13.0
[30] RCurl_1.98-1.17
[31] yulab.utils_0.2.1
[32] rappdirs_0.3.3
[33] git2r_0.36.2
[34] GenomeInfoDbData_1.2.13
[35] enrichplot_1.26.6
[36] tidytree_0.4.6
[37] codetools_0.2-20
[38] DelayedArray_0.32.0
[39] DOSE_4.0.1
[40] tidyselect_1.2.1
[41] aplot_0.2.8
[42] UCSC.utils_1.2.0
[43] farver_2.1.2
[44] matrixStats_1.5.0
[45] GenomicAlignments_1.42.0
[46] jsonlite_2.0.0
[47] Formula_1.2-5
[48] tools_4.4.2
[49] treeio_1.30.0
[50] TxDb.Hsapiens.UCSC.hg19.knownGene_3.2.2
[51] Rcpp_1.1.0
[52] glue_1.8.0
[53] SparseArray_1.6.2
[54] xfun_0.52
[55] qvalue_2.38.0
[56] MatrixGenerics_1.18.1
[57] withr_3.0.2
[58] fastmap_1.2.0
[59] boot_1.3-32
[60] callr_3.7.6
[61] caTools_1.18.3
[62] digest_0.6.37
[63] timechange_0.3.0
[64] R6_2.6.1
[65] gridGraphics_0.5-1
[66] seqPattern_1.38.0
[67] colorspace_2.1-1
[68] GO.db_3.20.0
[69] gtools_3.9.5
[70] dichromat_2.0-0.1
[71] RSQLite_2.4.3
[72] R.methodsS3_1.8.2
[73] utf8_1.2.6
[74] generics_0.1.4
[75] data.table_1.17.8
[76] rtracklayer_1.66.0
[77] httr_1.4.7
[78] htmlwidgets_1.6.4
[79] S4Arrays_1.6.0
[80] whisker_0.4.1
[81] pkgconfig_2.0.3
[82] gtable_0.3.6
[83] blob_1.2.4
[84] impute_1.80.0
[85] XVector_0.46.0
[86] htmltools_0.5.8.1
[87] carData_3.0-5
[88] fgsea_1.32.4
[89] scales_1.4.0
[90] png_0.1-8
[91] ggfun_0.2.0
[92] knitr_1.50
[93] rstudioapi_0.17.1
[94] tzdb_0.5.0
[95] reshape2_1.4.4
[96] rjson_0.2.23
[97] nlme_3.1-168
[98] curl_7.0.0
[99] cachem_1.1.0
[100] KernSmooth_2.23-26
[101] parallel_4.4.2
[102] restfulr_0.0.16
[103] pillar_1.11.0
[104] vctrs_0.6.5
[105] gplots_3.2.0
[106] promises_1.3.3
[107] car_3.1-3
[108] evaluate_1.0.5
[109] cli_3.6.5
[110] compiler_4.4.2
[111] Rsamtools_2.22.0
[112] rlang_1.1.6
[113] crayon_1.5.3
[114] labeling_0.4.3
[115] ps_1.9.1
[116] getPass_0.2-4
[117] plyr_1.8.9
[118] fs_1.6.6
[119] stringi_1.8.7
[120] gridBase_0.4-7
[121] Biostrings_2.74.1
[122] lazyeval_0.2.2
[123] GOSemSim_2.32.0
[124] Matrix_1.7-3
[125] BSgenome_1.74.0
[126] hms_1.1.3
[127] patchwork_1.3.2
[128] bit64_4.6.0-1
[129] KEGGREST_1.46.0
[130] SummarizedExperiment_1.36.0
[131] igraph_2.1.4
[132] broom_1.0.9
[133] memoise_2.0.1
[134] bslib_0.9.0
[135] ggtree_3.14.0
[136] fastmatch_1.1-6
[137] bit_4.6.0
[138] ape_5.8-1